数据集heart_learning.csv与heart_test.csv是关于心脏病的数据集,heart_learning.csv是训练数据集,heart_test.csv是测试数据集。要求:target和target2为因变量,其他诸变量为自变量。用决策树模型对target和target2做预测,并与实际值比较来验证预测情况。变量说明:pain,ekg,slope,thal是分类变量,在做模型训练前需要对其进行转换为因子型变量。target是定类多值因变量,target2是二值变量,文中分别对其进行预测。
| 变量名称 | 变量说明 |
| age | 年龄 |
| sex | 性别,取值1代表男性,0代表女性 |
| pain | 胸痛的类型,取值1,2,3,4,代表4种类型 |
| bpress | 入院时的静息血压(单位:毫米汞柱) |
| chol | 血清胆固醇(单位:毫克/分升) |
| bsugar | 空腹血糖是否大于120毫克/公升,1代表是,0代表否 |
| ekg | 静息心电图结果,取值0,1,2代表3中不同的结果 |
| thalach | 达到的最大心率 |
| exang | 是否有运动性心绞痛,1代表是0代表否 |
| oldpeak | 运动引起的ST段压低 |
| slope | 锻炼高峰期ST段的斜率,取值1代表上斜,2代表平坦,3代表下斜 |
| ca | 荧光染色的大血管数目,取值为0,1,2,3 |
| thal | 取值3代表正常,取值6代表固定缺陷,取值7代表可逆缺陷 |
| target | 因变量,直径减少50%以上的大血管数目,取值0,1,2,3,4 |
| target2 | 因变量,取值1表示target大于0,取值0表示target等于0 |
在本文中我们使用tuneRF()函数,为训练数据集选择最优调节参数mtry来建立随机森林模型,并把模型应用于测试数据集进行预测。
二、对二元因变量target2进行预测
1、导入分析包和数据集
library(rpart)
library(dplyr)
library(randomForest)
并对heart_learning和heart_test数据集各分类变量转换为因子变量
heart_learning<-read.csv('F:/桌面/练习表格/heart_learning.csv',
colClasses=rep('numeric',15)) %>% mutate(pain=as.factor((pain))) %>%
mutate(ekg=as.factor(ekg)) %>% mutate(slope=as.factor(slope)) %>% mutate(thal=as.factor(thal))
heart_test<-read.csv('F:/桌面/练习表格/heart_test.csv',
colClasses=rep('numeric',15)) %>% mutate(pain=as.factor((pain))) %>%
mutate(ekg=as.factor(ekg)) %>% mutate(slope=as.factor(slope)) %>% mutate(thal=as.factor(thal))
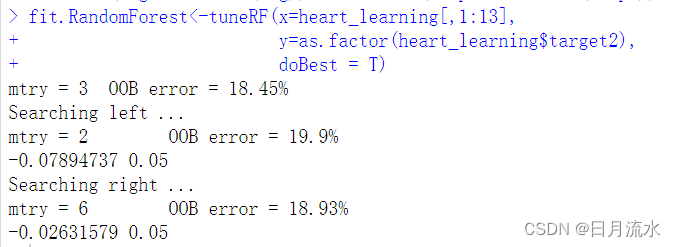
2、建立随机森林模型,使用tuneRF()函数,为训练数据集选择最优调节参数mtry
fit.RandomForest<-tuneRF(x=heart_learning[,1:13], y=as.factor(heart_learning$target2),
doBest = T)
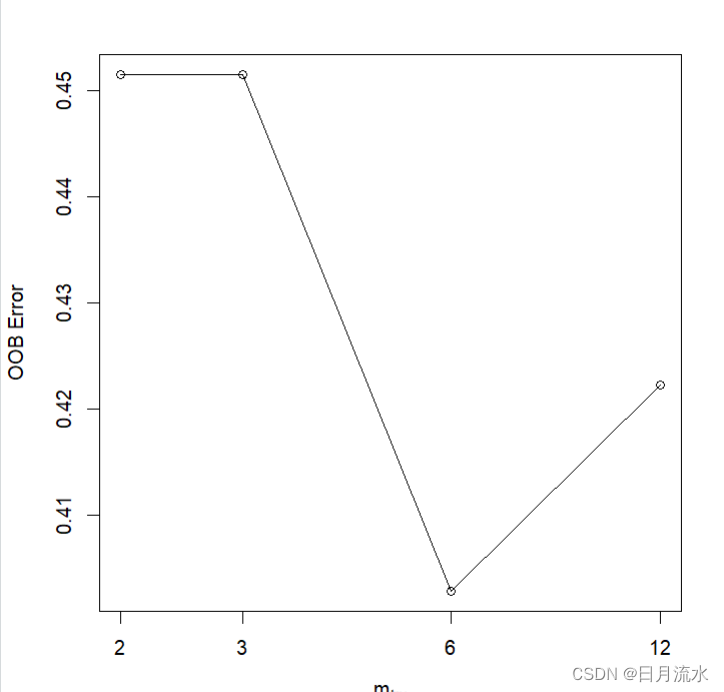
运行得到:最优mtry为3.
3、显示随机森林模型fit.RandomForest模型细节

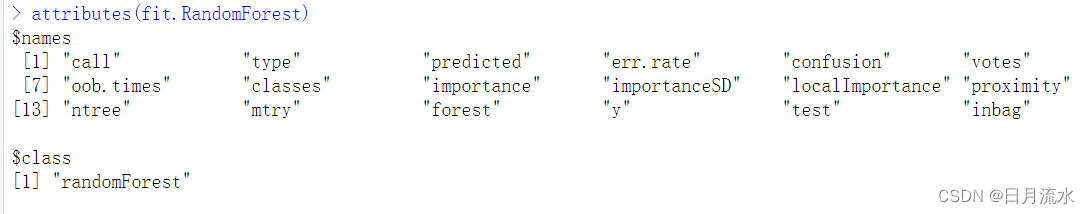
4、显示fit.RandomForest模型结果与包括生成项目
attributes(fit.RandomForest)
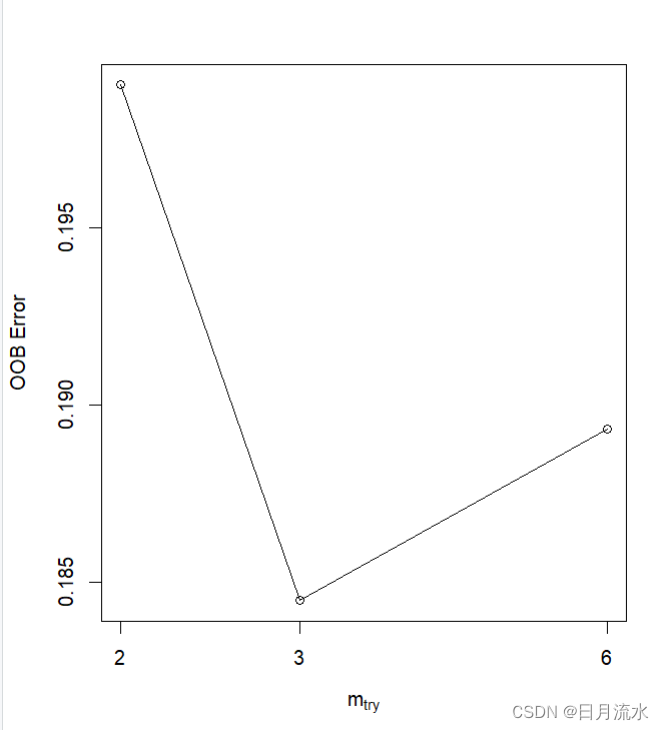
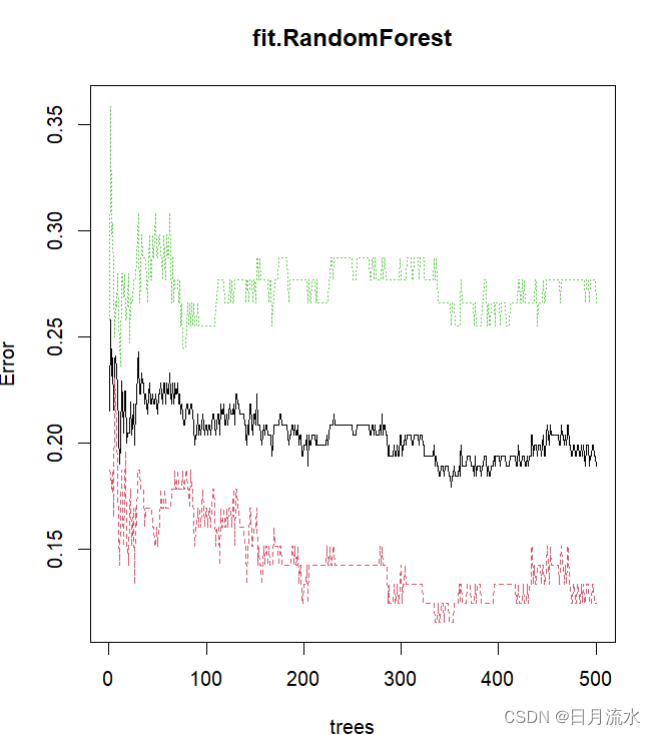
5、根据随机森林fit.RandomForest生成的不同树,来绘制误差率
plot(fit.RandomForest)
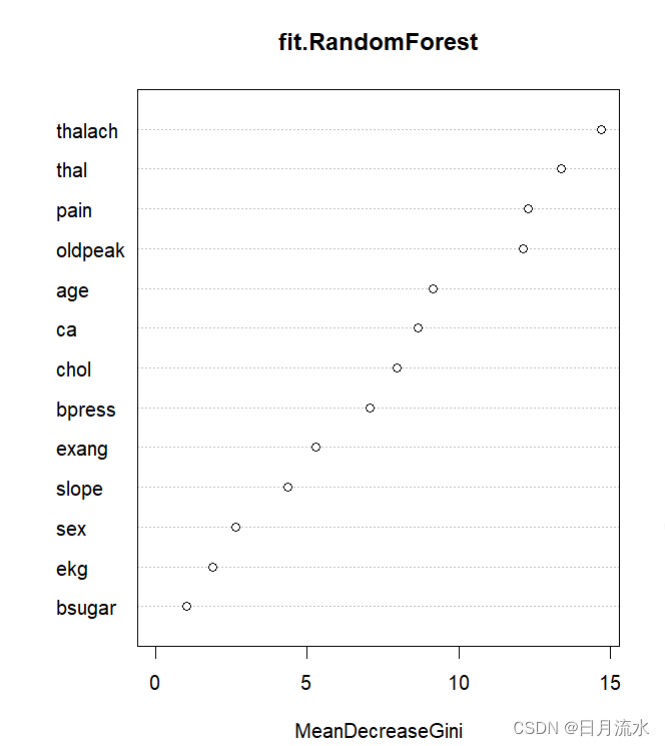
6、得到随机森林各变量的重要程度
importance(fit.RandomForest)
varImpPlot(fit.RandomForest)
importance(fit.RandomForest)
        MeanDecreaseGini
age             9.168844
sex             2.641959
pain           12.301841
bpress          7.065327
chol            7.962259
bsugar          1.020983
ekg             1.866126
thalach        14.721451
exang           5.268893
oldpeak        12.147604
slope           4.348458
ca              8.667818
thal           13.389062
7、训练数据集heart_learning拟合效果
table(predict(fit.RandomForest),heart_learning$target2)
 table(predict(fit.RandomForest),heart_learning$target2)

     0  1
  0 98 25
  1 14 69
8、把得到的随机森林模型运用到测试数据集中heart_test.
prob.RandomForest.tuned<-predict(fit.RandomForest,heart_test[,1:13],type = 'prob')[,2]
class.RandomForest<-1*(prob.RandomForest.tuned>0.5)
conmat.RandomForest<-table(heart_test$target2,class.RandomForest)
conmat.RandomForest
运行得到:
conmat.RandomForest
   class.RandomForest
     0  1
  0 42  6
  1  9 34
或者
pred.RandomForest.tuned<-predict(fit.RandomForest,heart_test[,1:13])
pred.RandomForest.tuned
table(pred.RandomForest.tuned,heart_test$target2)
table(pred.RandomForest.tuned,heart_test$target2)

pred.RandomForest.tuned  0  1
                      0 42  9
                      1  6 34
得到同样的结果
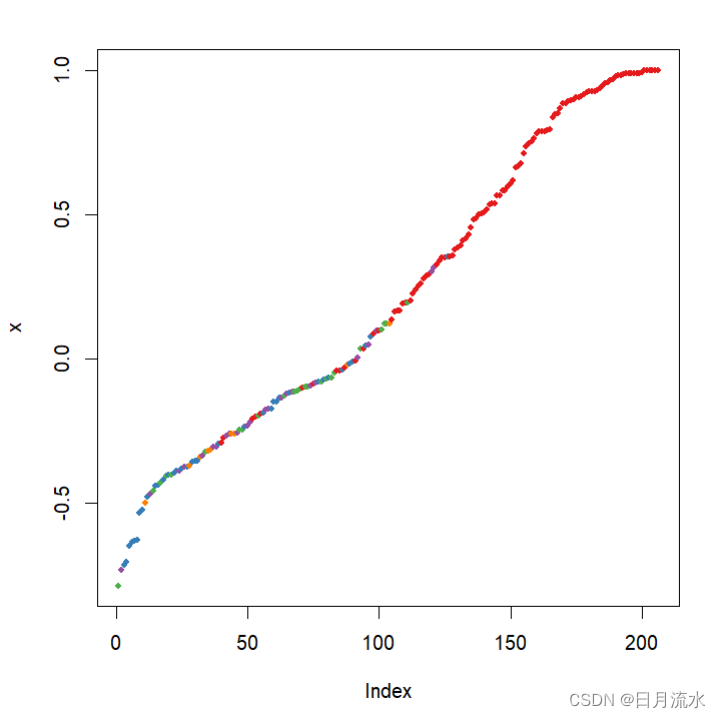
9、图形表示随机森林的测试效果,
plot(margin(fit.RandomForest,heart_test$target2))
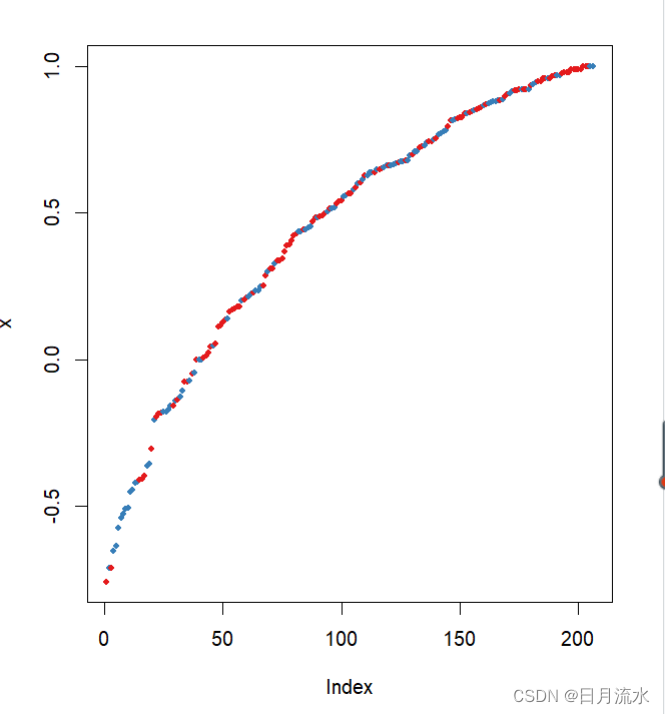
数据点的边距为正确分类的比率减去被分到其他类别的最大比率,边距为正数说明数据划分正确。
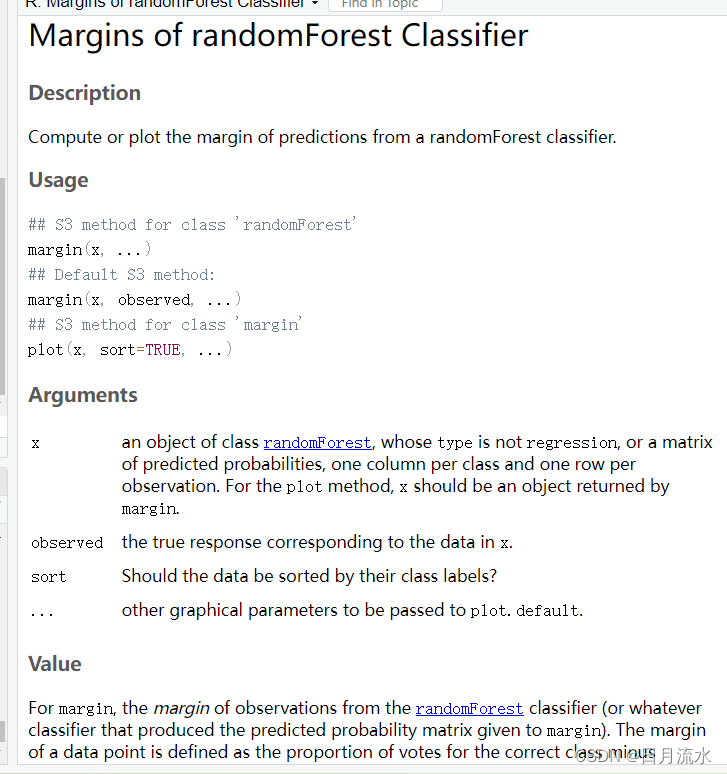
help("margin")参考图形的具体含义
三、对多值因变量target进行预测
1、建立模型
fit.RandomForest <- tuneRF(x = heart_learning[,1:13],
y = as.factor(heart_learning$target),
doBest = T)
2、使用建立的随机森林模型对数据集进行预测,预测分类概率和预测类别
prob.RandomForest <-predict(fit.RandomForest,heart_test[,1:13],type="prob")
class.RandomForest <- apply(prob.RandomForest,1,which.max)-1
3、数据集的预测的效果
分类准确率
accu.1 <-
length(which(class.RandomForest==heart_test$target))/length(heart_test$target)
距离概念的分类准确率
accu2 <- mean(1-abs(class.RandomForest-heart_test$target)/(4-0))
accu.target1
accu.target2
运行得到:
accu.target2 <-
+   mean(1-abs(class.RandomForest-heart_test$target)/(4-0))
> accu.target1
[1] 0.5274725
> accu.target2
[1] 0.8214286
4、真实值与预测值的列联表
table(class.RandomForest,heart_test$target)
table(class.RandomForest,heart_test$target)

class.RandomForest  0  1  2  3  4
                 0 47 12  5  3  1
                 1  1  0  3  3  1
                 2  0  3  1  4  1
                 3  0  2  2  0  1
                 4  0  0  0  1  0
5、图形表示随机森林的测试效果
plot(margin(fit.RandomForest,heart_test$target))