目录
- 配置Prometheus
- 配置Grafana
一、配置Prometheus
Prometheus简介
- Promethues是一款开源系统监控和警报工具。使用Go语言开发,有各种 exporter用来收集服务器性能数据。
- 我们通过Promethues来监控压测时服务端的性能。
部署Prometheus
- 编辑配置文件:https://github.com/prometheus/prometheus/blob/master/documentation/examples/prometheus.yml
-
vim prometheus.yml,输入下面的内容
# my global config
global:
  scrape_interval:     15s # Set the scrape interval to every 15 seconds. Default is every 1 minute.
  evaluation_interval: 15s # Evaluate rules every 15 seconds. The default is every 1 minute.
  # scrape_timeout is set to the global default (10s).

# Alertmanager configuration
alerting:
  alertmanagers:
  - static_configs:
    - targets:
      # - alertmanager:9093

# Load rules once and periodically evaluate them according to the global 'evaluation_interval'.
rule_files:
  # - "first_rules.yml"
  # - "second_rules.yml"

# A scrape configuration containing exactly one endpoint to scrape:
# Here it's Prometheus itself.
scrape_configs:
  # The job name is added as a label `job=<job_name>` to any timeseries scraped from this config.
  - job_name: 'prometheus'

    # metrics_path defaults to '/metrics'
    # scheme defaults to 'http'.

    static_configs:
    - targets: ['localhost:9090']
-
运行:
docker run -d --name prometheus --network grafana -p 9090:9090 -v ${PWD}/prometheus.yml:/etc/prometheus/prometheus.yml prom/prometheus:v2.16.0 --config.file=/etc/prometheus/prometheus.yml-
run:启动容器 -
-d:后台运行 -
--name:指定容器名 -
--network:指定容器网络 -
-p:指定端口 -
-v:将将promethus.yml挂载到/etc/prometheus/prometheus.yml路径 -
--config.file:指定配置文件为容器里的/etc/prometheus/prometheus.yml文件

-
-
访问9090端口

-
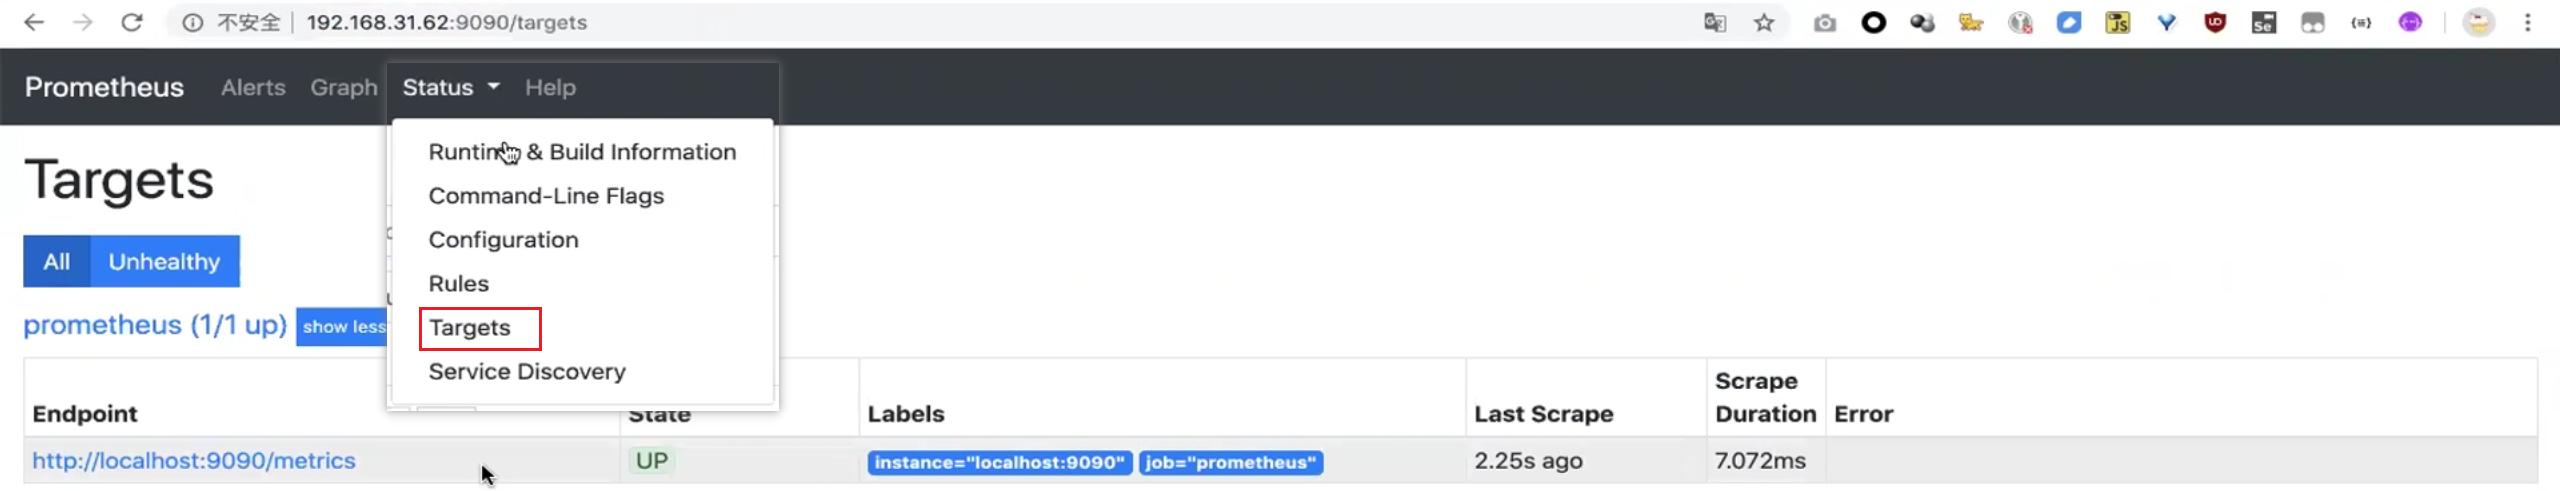
查看容器状态:Status->Targets
部署node_exporter到需要被监控的主机上
-
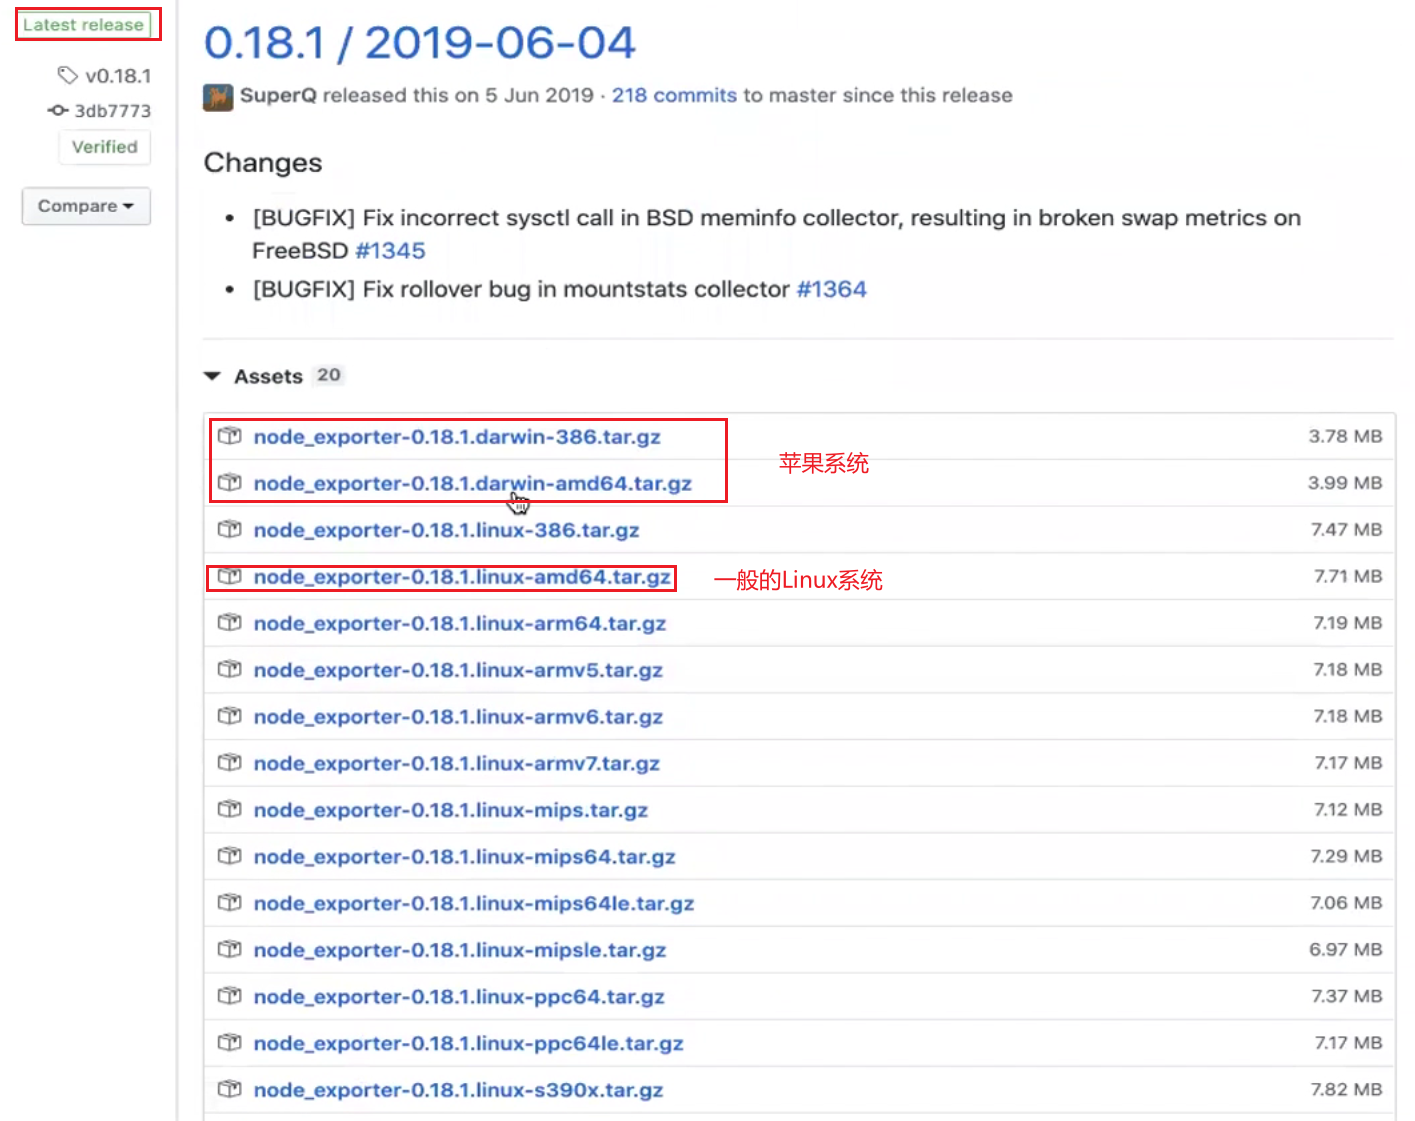
选择稳定版本下载node_exporter:https://github.com/prometheus/node_exporter/releases
-
解压文件并运行
tar -xzvf node_exporter-1.1.2.linux-amd64.tar.gz- 查看帮助信息
./node_exporter --help:

- 指定端口并在后台运行:
nohup ./node_exporter --web.listen-address=":9102" &,其中nohup xxx &即在后台运行,--web.listen-address=":9102"如果主机有多个ip地址,还可以指定ip地址,如--web.listen-address="192.168.31.62:9102"

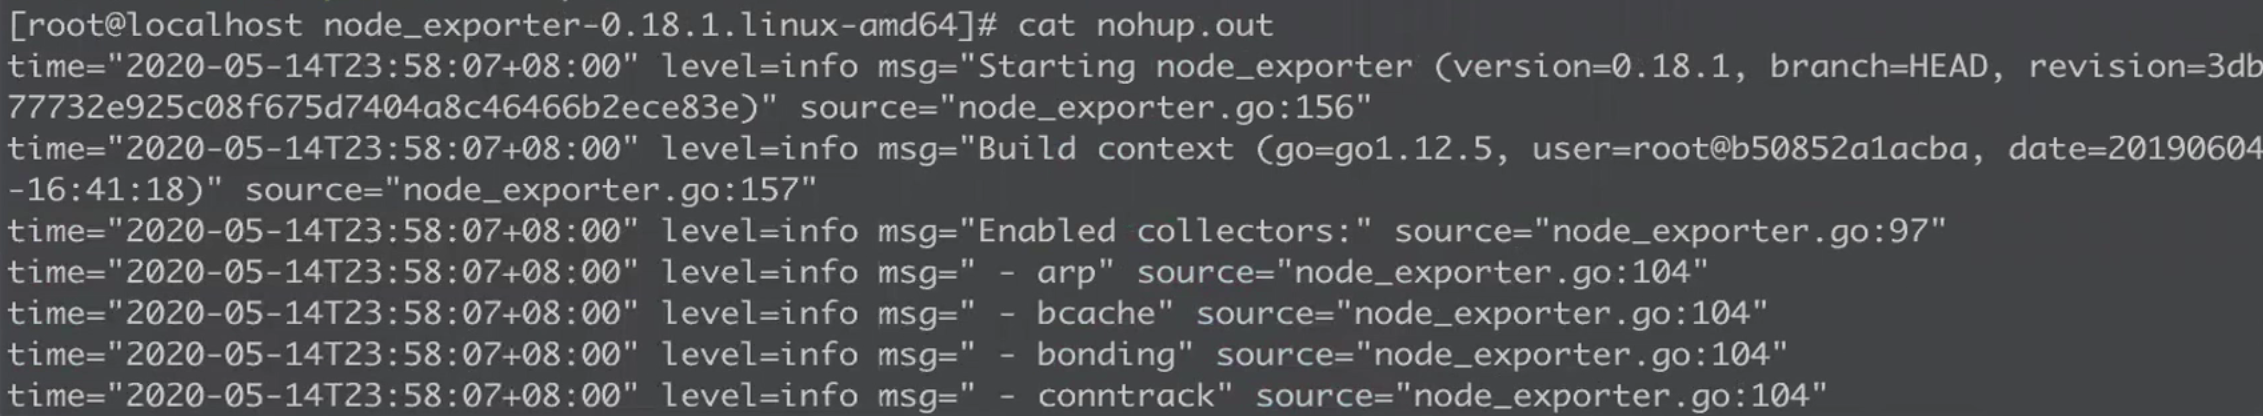
- 查看nohub输出:
cat nohub.out
开放9102端口:
/sbin/iptables -I INPUT -p tcp --dport 8080 -j ACCEPT-
访问9102端口:

配置node_exporter 到 Prometheus
-
vim prometheus.yml

配置node_exporter,其中
job_name可以随便填
- job_name: 'CentOS 192.168.31.61'
  static_configs:
  - targets: ['192.168.31.61:9102']
-
重启Prometheus
-
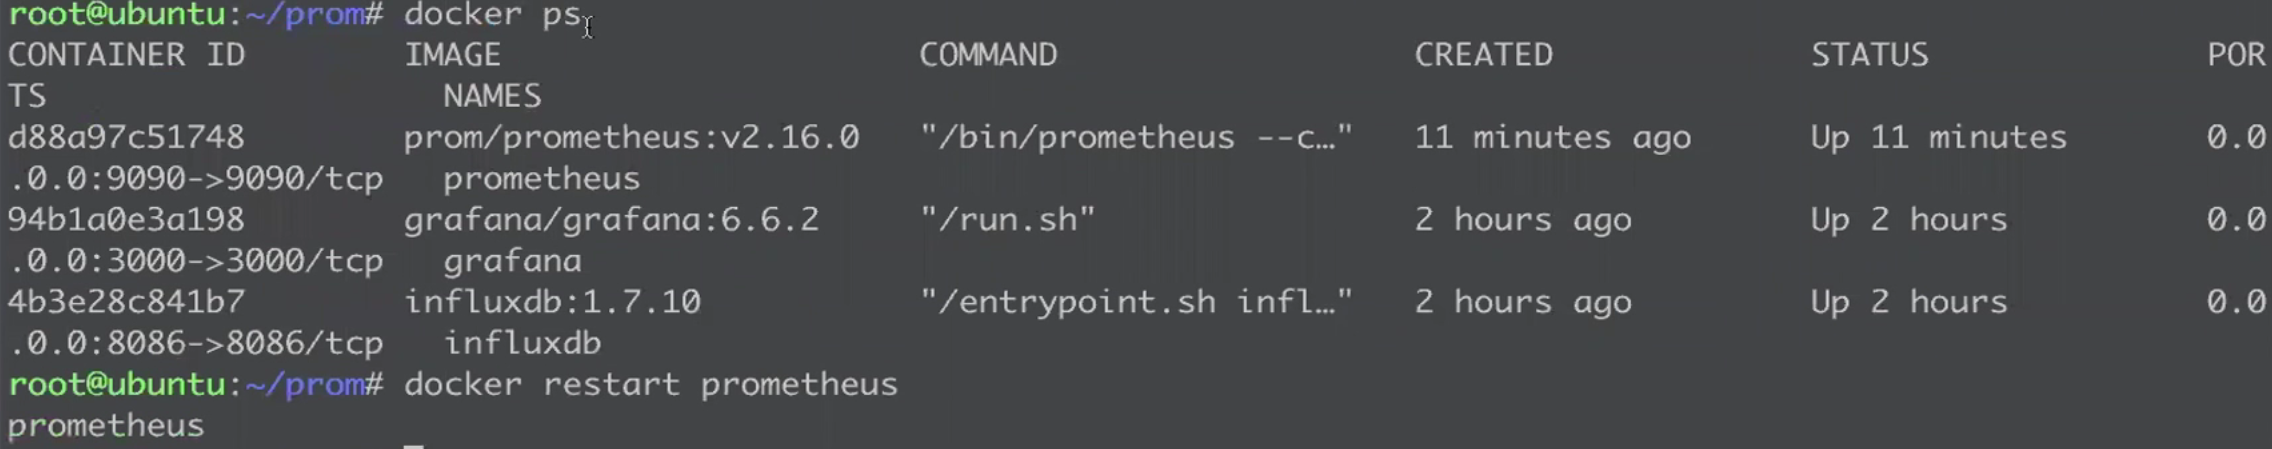
docker ps:查看容器进程 -
docker restart prometheus:重启
-
-
进入9090端口查看Prometheus状态:多出主机监听目标

二、配置Grafana
配置Data Source,收集服务器数据
-
进入Data Source

-添加Prometheus


- 配置Prometheus数据源
- scrape interval时长在
prometheus.yml中查看

- URL:
http://prometheus:9090
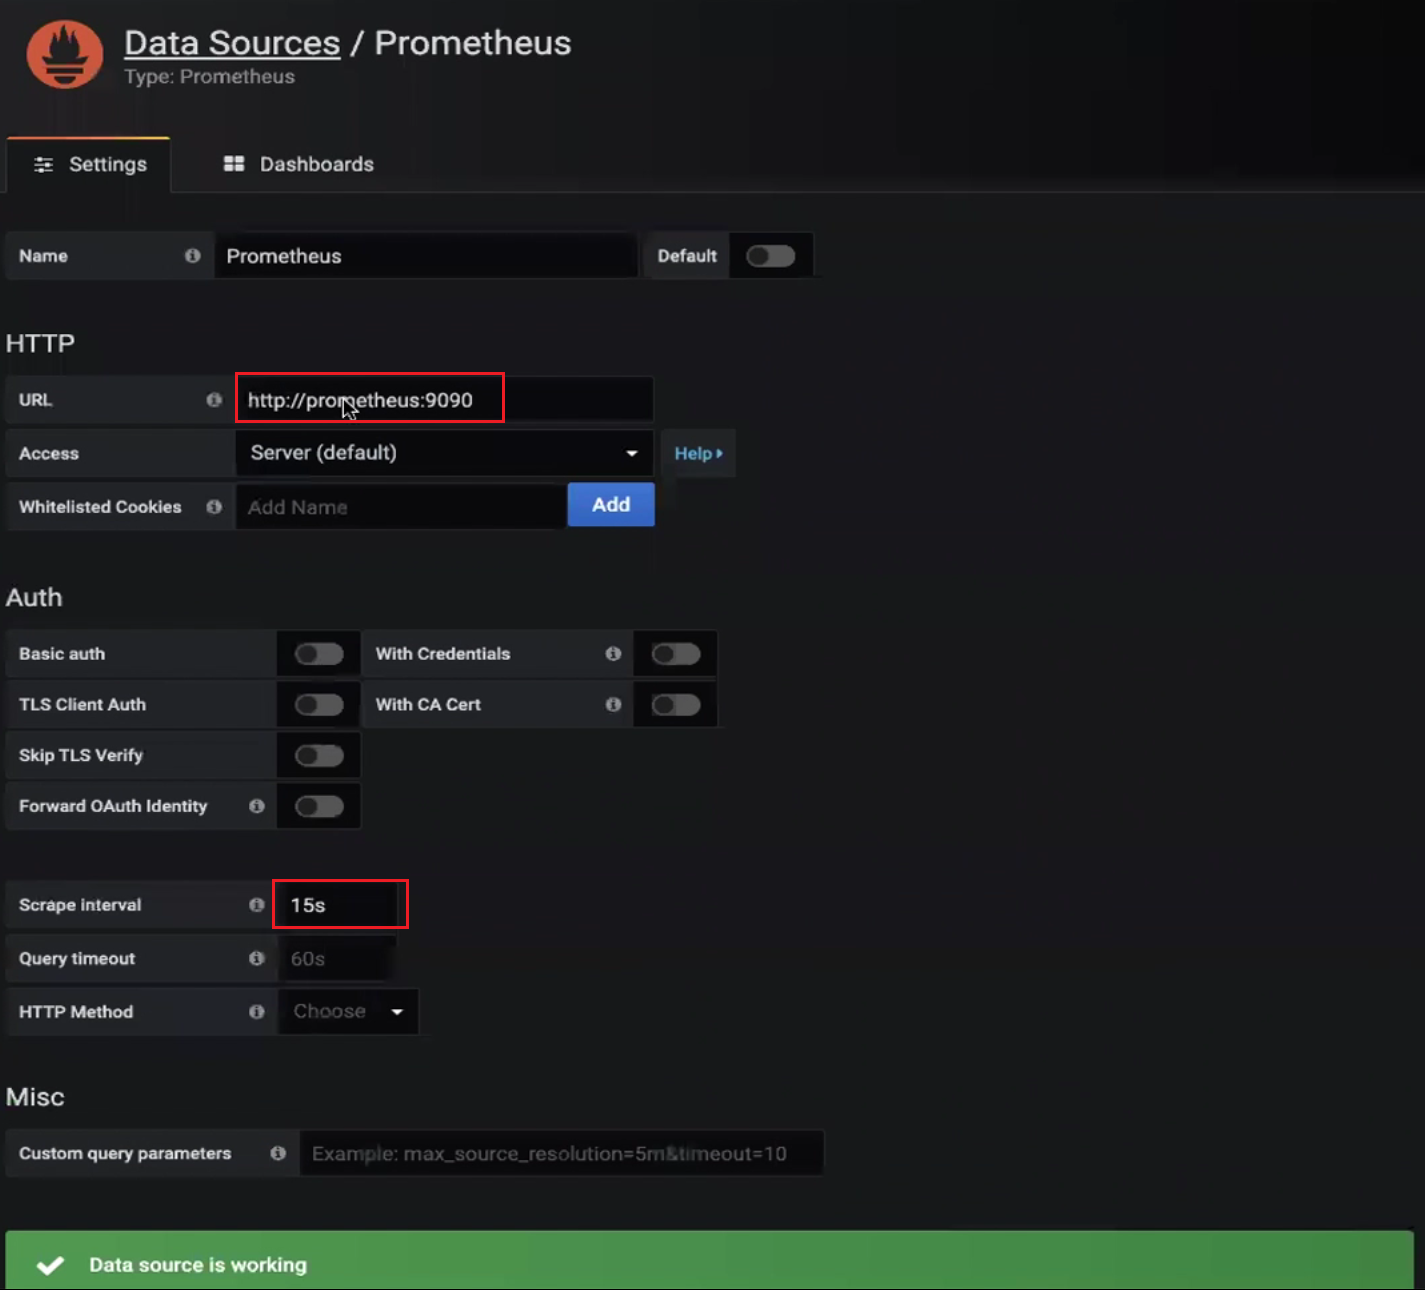
- 点击:
Save & Test提示working表示配置成功

- scrape interval时长在
配置Dashboard
-
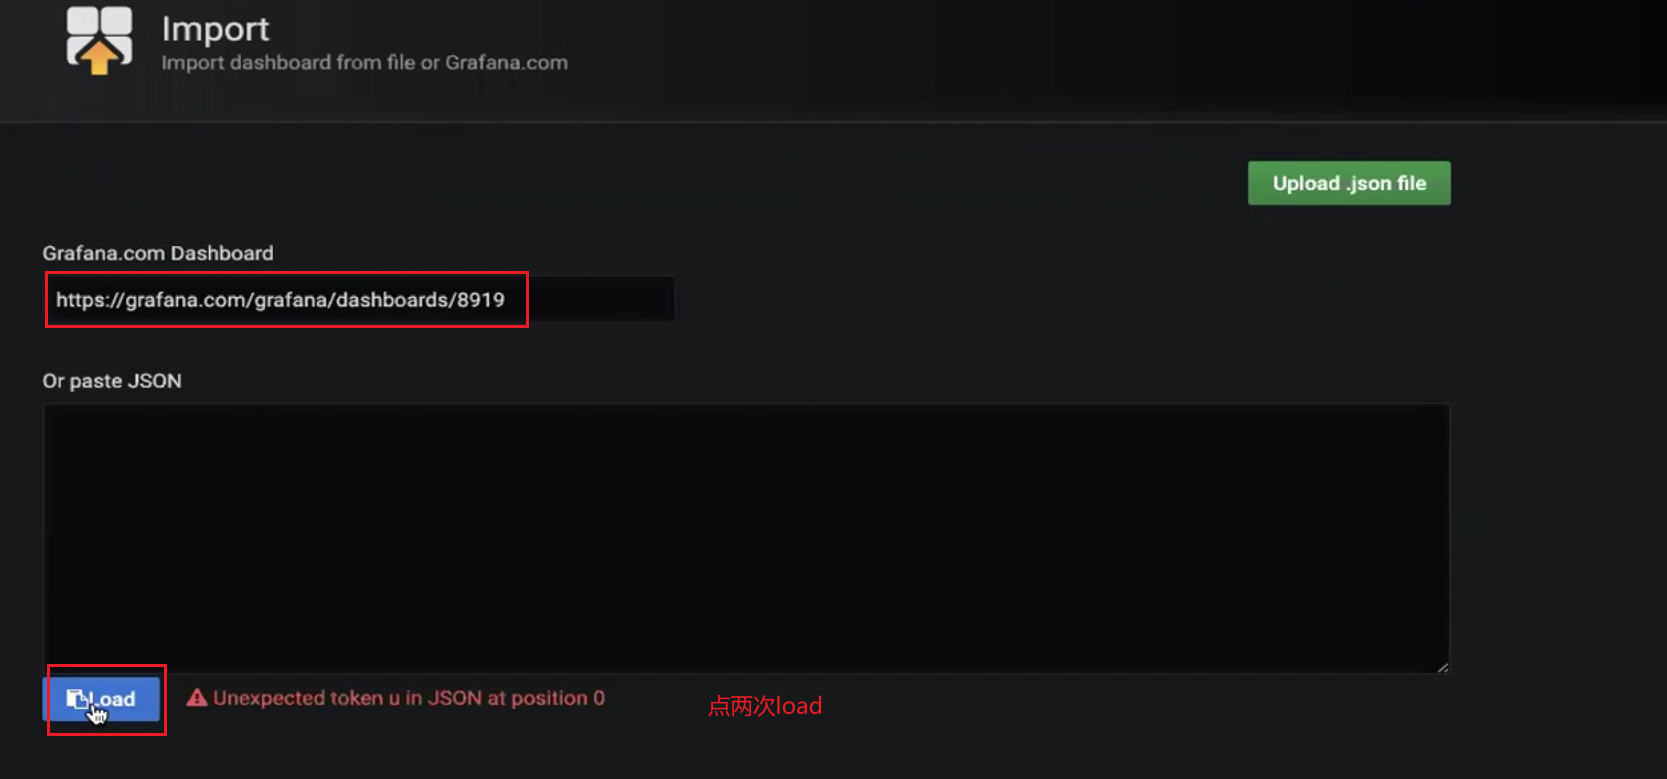
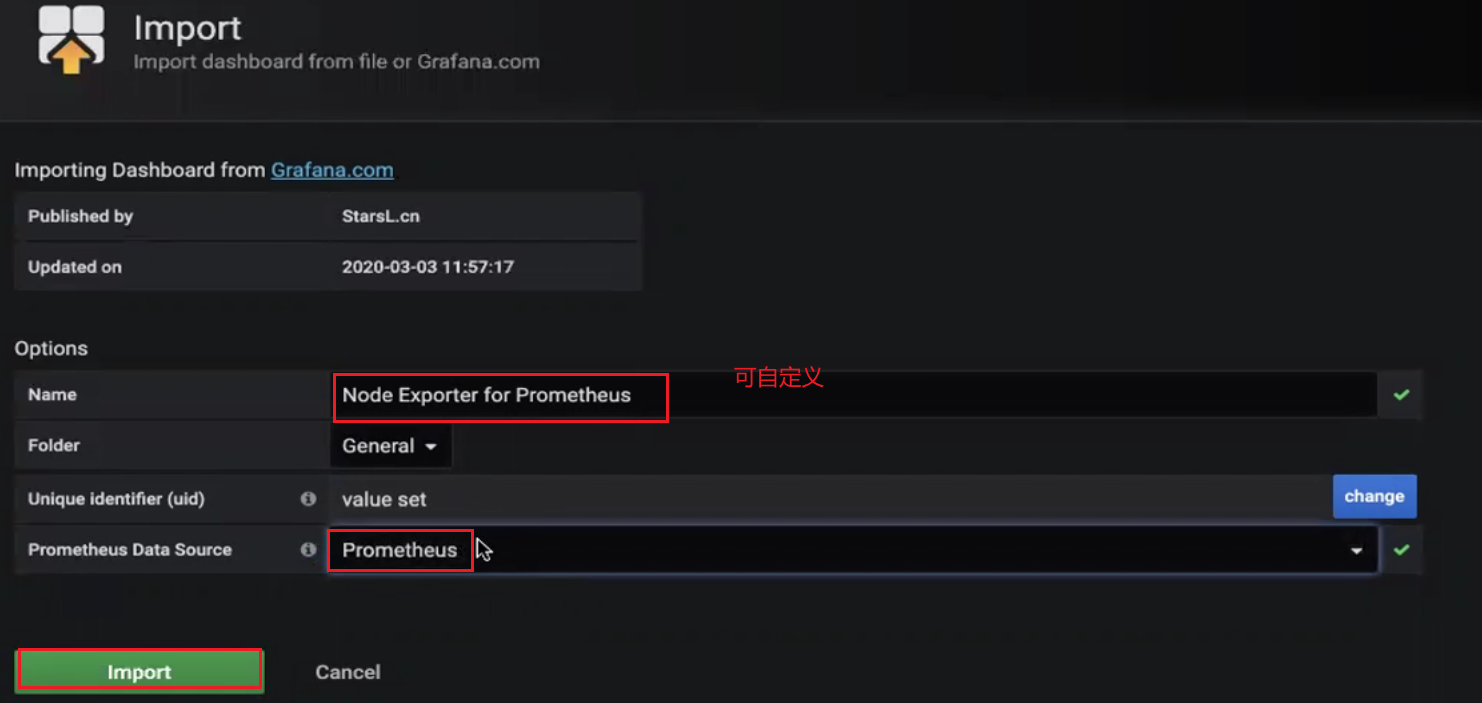
Prometheus的Grafana Dashboard地址:https://grafana.com/grafana/dashboards/8919

-
导入Dashboard:


进行测试
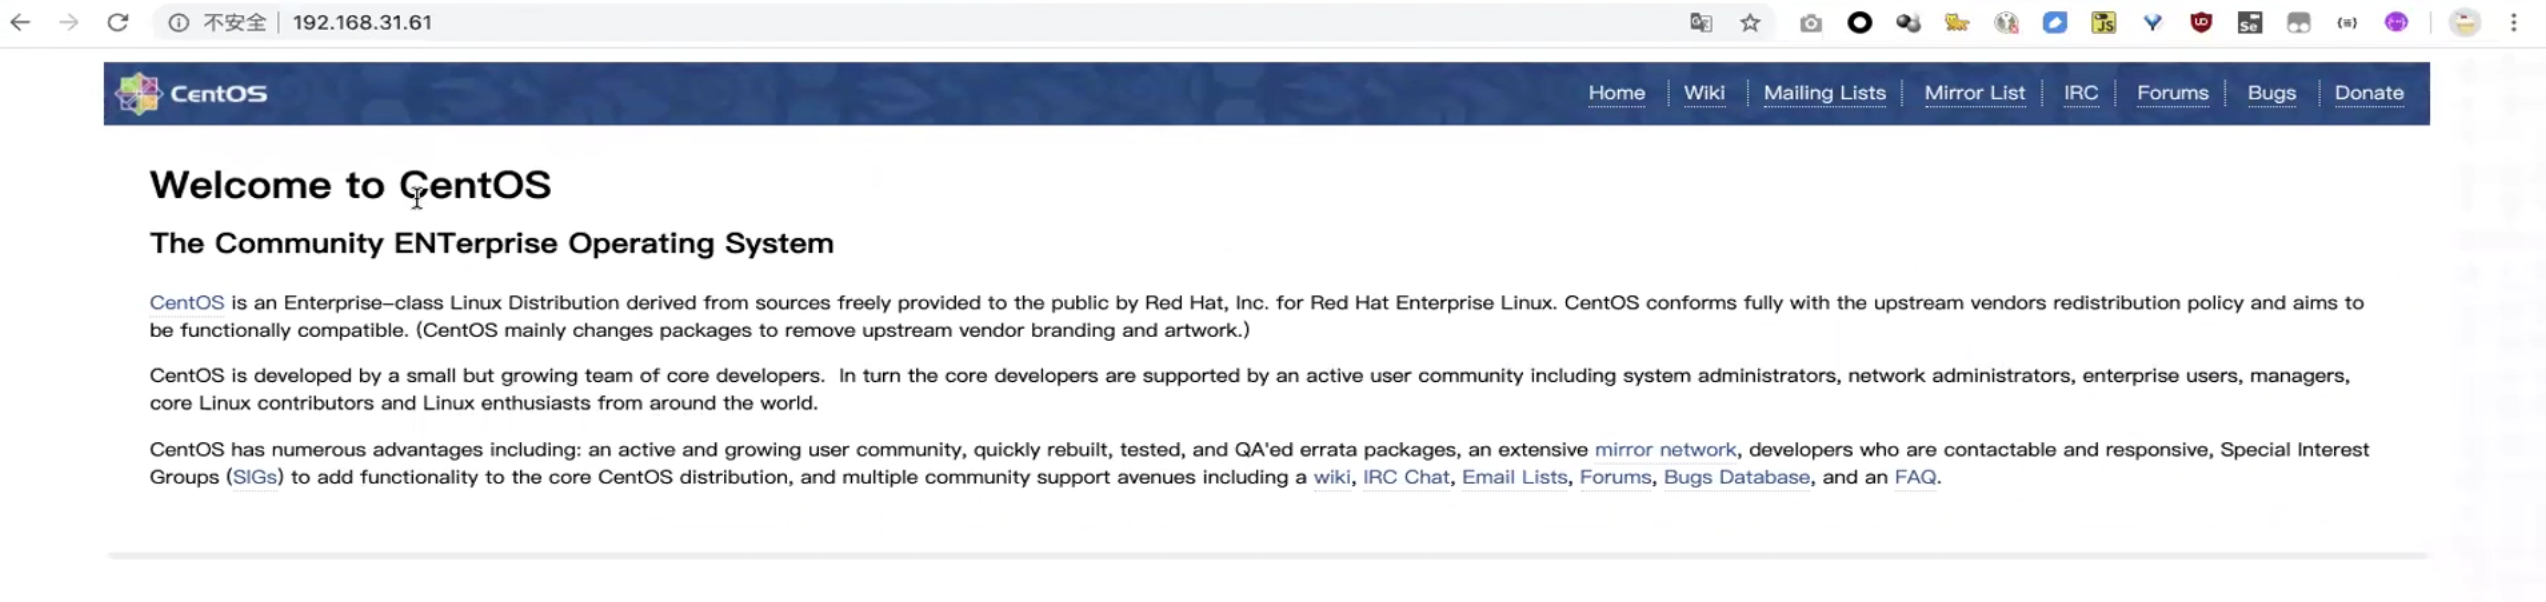
查看系统版本:
cat /etc/redhat-release-
下载nginx服务器:
yum install nginx

重启nginx:
systemctl restart nginx-
访问80端口,重启成功
-
打开JMeter进行压测

-
使用终端形式运行压测脚本:
./jmeter.sh -n -t bl.jmx
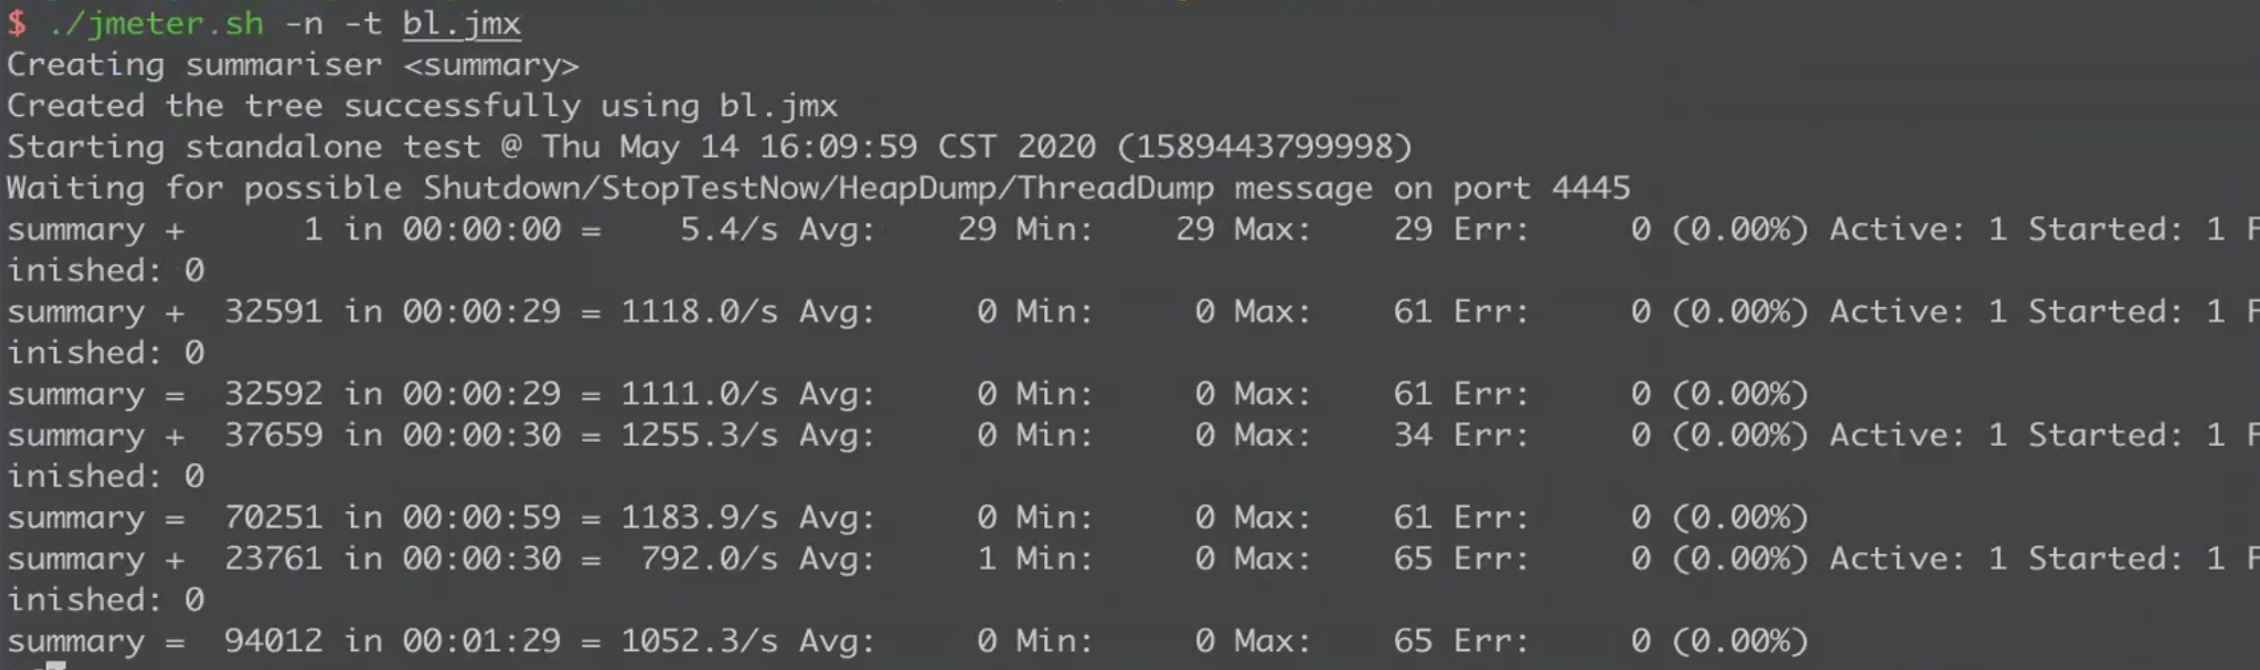
查看结果
-
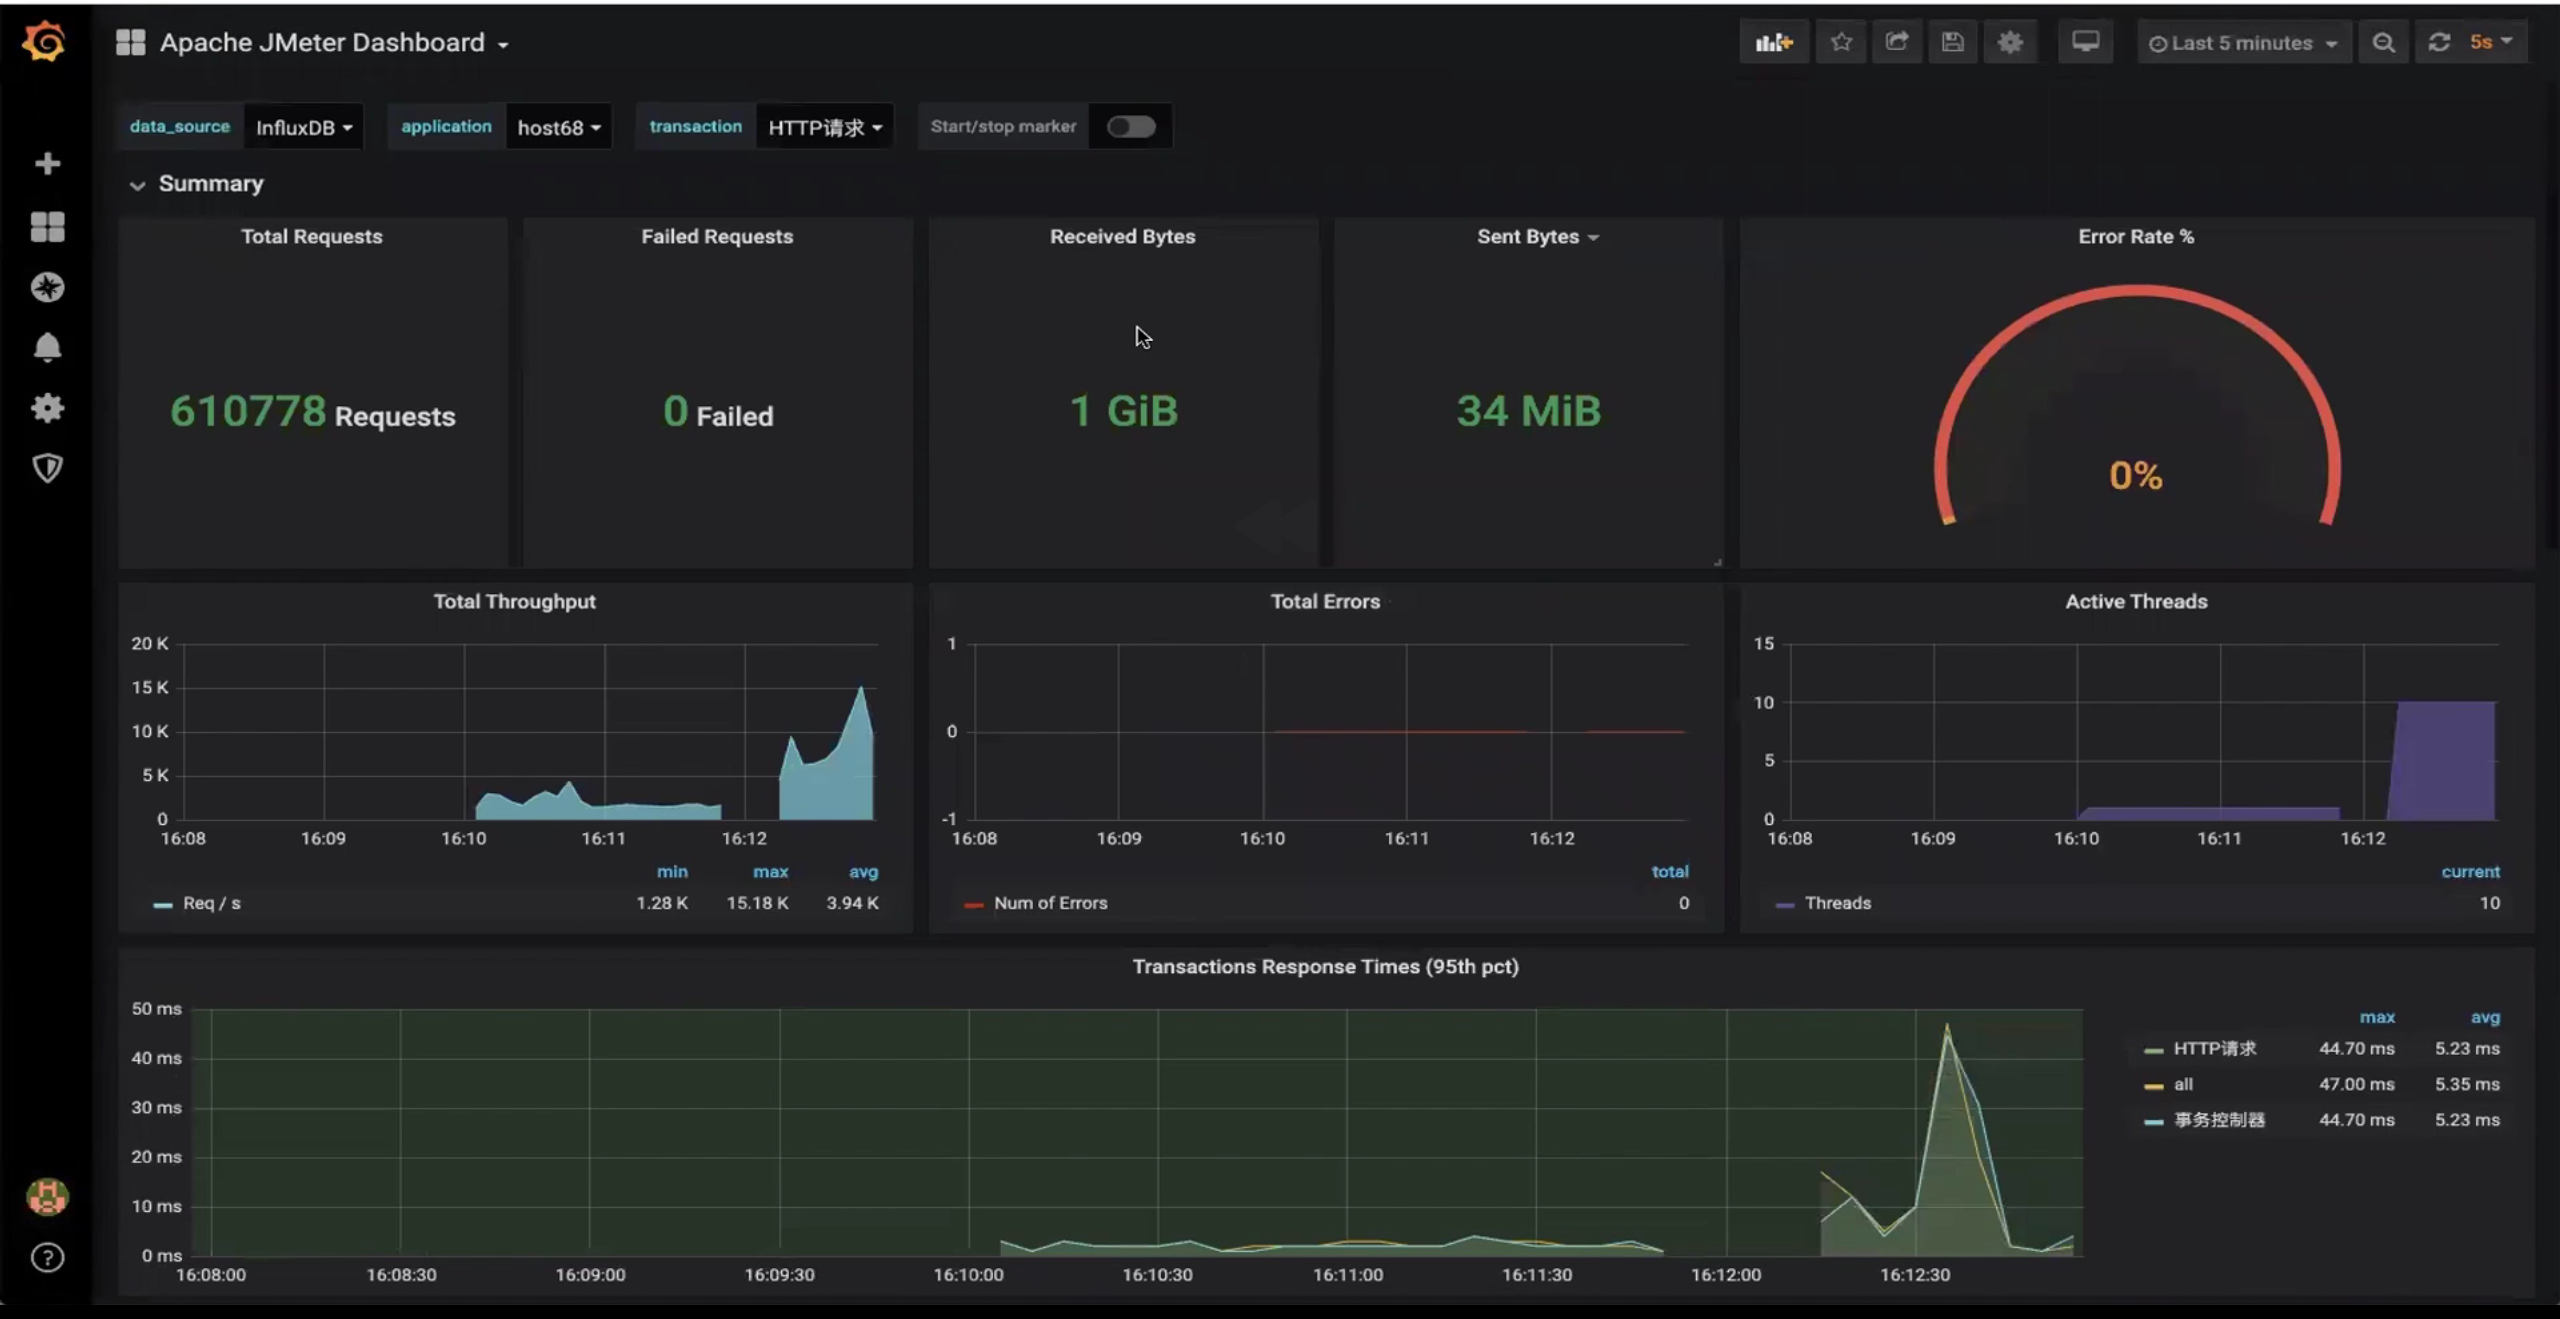
Influxdb监控面板

-
Prometheus监控面板

增加线程组进行压测
-
vim bl.jmx,增加线程组至10

再次运行脚本:
./jmeter.sh -n -t bl.jmx-
查看结果