本文尝试总结利用matlab画二维线图的常用函数,将会涉及plot函数、线图格式设置、线图信息设置、多线图绘制等。后期如接触更多二维线图绘制的方法还会持续更新。力求用最简单的方法完成Matlab二维线图的快速入门。
基本函数plot
| 函数名 | plot |
| 含义 | 二维线图绘制 |
| 用法 | plot(x,y) |
| 说明 | 创建对应于 x 值的 y 值的二维线图。x 和 y 应为长度相同的向量。 |
线图格式
'FontSize' --设置线图中所有字母数字的字号
'LineWidth' --设置坐标轴,网格线及图例边框的线宽
'XColor' --x坐标轴的颜色,[0 0 0]为黑色
'YColor' --y坐标轴的颜色,[0 0 0]为黑色
set(gca,'FontSize',12,'LineWidth',1,'XColor',[0 0 0],'YColor',[0 0 0]);线图信息
| 标题 | title('this is a title'); |
| 坐标标签 | xlabel('Voltage / V'); ylabel('Current / A'); 标签也可插入希腊字母,如电流微安:'\muA' |
| 坐标轴范围 | xlim([-10 10]); ylim([-100 100]); |
| 图例及位置 | plot(x,y,'DisplayName', 'legend content'); legend('Location','bestoutside'); legend show; |
| 网格线 | grid on; % 显示网格线 grid off; % 删除网格线 |
绘制多个线条
方法1:对于多组向量数据 x1,y1;x2,y2; ... ;xn, yn,可以使用plot函数在同一组坐标轴上绘制
plot(x1,y1,x2,y2,x3,y3);方法2:hold + for循环
hold on;
for ii = 1:1:length(y)
    plot(x,y{ii},'DisplayName',num2str(ii));
end

hold off;
结合上述内容的实例:
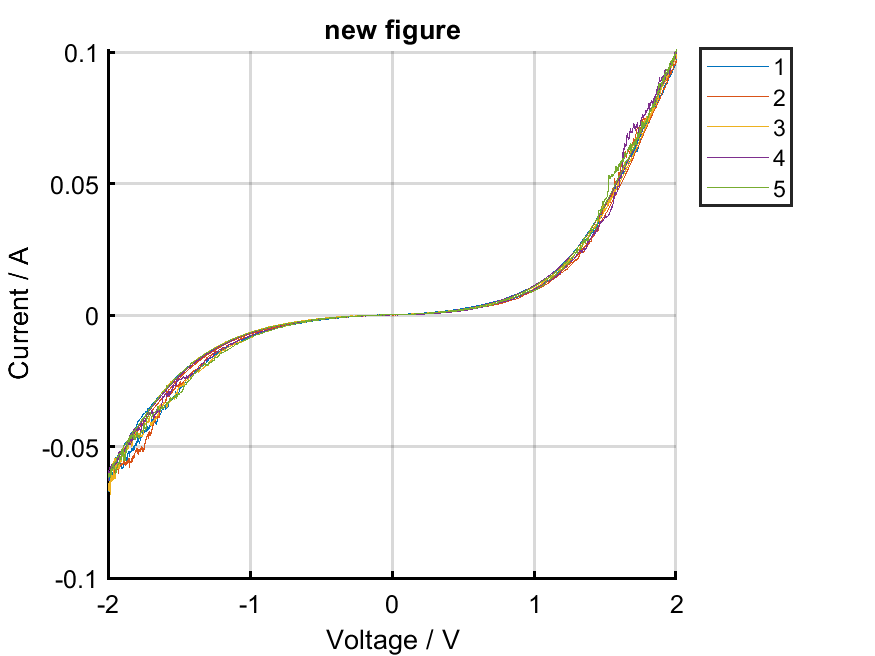
Title = ['new figure'];
hold on;
for ii = 1:1:length(y)
    plot(x, y{ii},'DisplayName',num2str(ii));
end
xlabel('Voltage / V'); ylabel('Current / A')
set(gca,'FontSize',12,'LineWidth',1,'XColor',[0 0 0],'YColor',[0 0 0]);
title(Title)
legend('Location','bestoutside');
grid on;
hold off;
legend show;
上述代码的绘制结果: