在Linux或其他UNIX和类UNIX环境下,ps命令想必大家都不陌生,我相信也有不少同学写过 ps aux | grep java | grep -v grep | awk '{print $2}' 这样的管道命令来找出Java进程的pid。常言道,Java并非真的"跨平台",它自己就是平台。作为平台,当然也有些基本的工具,让我们可以用更简单、更统一,同时又是非侵入的方式来查询进程相关信息。今天我们就来认识一下其中的两个。
jps
顾名思义,它对应到UNIX的ps命令。用法如下:
jps [ options ] [ hostid ]
其中,options可以用 -q (安静) -m (输出传递给main方法的参数) -l (显示完整路径) -v (显示传递给JVM的命令行参数) -V (显示通过flag文件传递给JVM的参数) -J (和其他Java工具类似用于传递参数给命令本身要调用的java进程);hostid是主机id,默认localhost。
jstat
用于输出给定java进程的统计信息。用法如下:
jstat -options 可以列出当前JVM版本支持的选项,常见的有 -class (类加载器) -compiler (JIT) -gc (GC堆状态) -gccapacity (各区大小) -gccause (最近一次GC统计和原因) -gcnew (新区统计) -gcnewcapacity (新区大小) -gcold (老区统计) -gcoldcapacity (老区大小) -gcpermcapacity (永久区大小) -gcutil (GC统计汇总) -printcompilation (HotSpot编译统计)
假定你要监控的Java进程号是12345,那么
jstat -gcutil -t 12345 200 300 即可每200毫秒连续打印300次带有时间戳的GC统计信息。
简单解释一下: -gcutil是传入的option;必选,-t是打印时间戳,是以目标JVM启动时间为起点计算的,可选;12345是vmid/pid,和我们从jps拿到的是一样的,必选;200是监控时间间隔,可选,不提供就意味着单次输出;300是最大输出次数,可选,不提供且监控时间间隔有值的话,就是无限期打印下去。
具体输出明细的解释请参考官方文档 http://download.oracle.com/javase/6/docs/technotes/tools/share/jstat.html
命令格式
jstat命令命令格式:
jstat [Options] vmid [interval] [count]
参数说明:
Options,选项,我们一般使用 -gcutil 查看gc情况
vmid,VM的进程号,即当前运行的java进程号
interval,间隔时间,单位为秒或者毫秒
count,打印次数,如果缺省则打印无数次
示例说明
示例
通常运行命令如下:
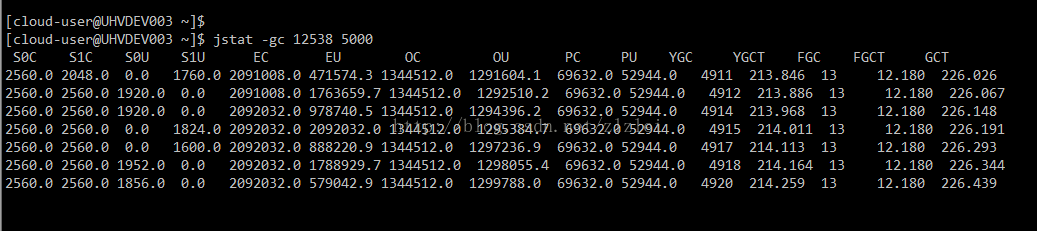
jstat -gc 12538 5000
即会每5秒一次显示进程号为12538的java进成的GC情况,
显示内容如下图:
结果说明
显示内容说明如下(部分结果是通过其他其他参数显示的,暂不说明):
S0C:年轻代中第一个survivor(幸存区)的容量 (字节)
S1C:年轻代中第二个survivor(幸存区)的容量 (字节)
S0U:年轻代中第一个survivor(幸存区)目前已使用空间 (字节)
S1U:年轻代中第二个survivor(幸存区)目前已使用空间 (字节)
EC:年轻代中Eden(伊甸园)的容量 (字节)
EU:年轻代中Eden(伊甸园)目前已使用空间 (字节)
OC:Old代的容量 (字节)
OU:Old代目前已使用空间 (字节)
PC:Perm(持久代)的容量 (字节)
PU:Perm(持久代)目前已使用空间 (字节)
YGC:从应用程序启动到采样时年轻代中gc次数
YGCT:从应用程序启动到采样时年轻代中gc所用时间(s)
FGC:从应用程序启动到采样时old代(全gc)gc次数
FGCT:从应用程序启动到采样时old代(全gc)gc所用时间(s)
GCT:从应用程序启动到采样时gc用的总时间(s)
NGCMN:年轻代(young)中初始化(最小)的大小 (字节)
NGCMX:年轻代(young)的最大容量 (字节)
NGC:年轻代(young)中当前的容量 (字节)
OGCMN:old代中初始化(最小)的大小 (字节)
OGCMX:old代的最大容量 (字节)
OGC:old代当前新生成的容量 (字节)
PGCMN:perm代中初始化(最小)的大小 (字节)
PGCMX:perm代的最大容量 (字节)
PGC:perm代当前新生成的容量 (字节)
S0:年轻代中第一个survivor(幸存区)已使用的占当前容量百分比
S1:年轻代中第二个survivor(幸存区)已使用的占当前容量百分比
E:年轻代中Eden(伊甸园)已使用的占当前容量百分比
O:old代已使用的占当前容量百分比
P:perm代已使用的占当前容量百分比
S0CMX:年轻代中第一个survivor(幸存区)的最大容量 (字节)
S1CMX :年轻代中第二个survivor(幸存区)的最大容量 (字节)
ECMX:年轻代中Eden(伊甸园)的最大容量 (字节)
DSS:当前需要survivor(幸存区)的容量 (字节)(Eden区已满)
TT: 持有次数限制
MTT : 最大持有次数限制
jstat
Monitors Java Virtual Machine (JVM) statistics. This command is experimental and unsupported.
Synopsis
jstat [ generalOption | outputOptions vmid [ interval[s|ms] [ count ] ]
generalOptionA single general command-line option -help or -options. See General Options.outputOptionsOne or more output options that consist of a single statOption, plus any of the -t, -h, and -J options. See Output Options.vmid
Virtual machine identifier, which is a string that indicates the target JVM. The general syntax is the following:
[protocol:][//]lvmid[@hostname[:port]/servername]
The syntax of the vmid string corresponds to the syntax of a URI. The vmid string can vary from a simple integer that represents a local JVM to a more complex construction that specifies a communications protocol, port number, and other implementation-specific values. See Virtual Machine Identifier.interval [s|ms]
Sampling interval in the specified units, seconds (s) or milliseconds (ms). Default units are milliseconds. Must be a positive integer. When specified, the jstatcountNumber of samples to display. The default value is infinity which causes the jstat command to display statistics until the target JVM terminates or the jstat
Description
The jstat command displays performance statistics for an instrumented Java HotSpot VM. The target JVM is identified by its virtual machine identifier, or vmid
Virtual Machine Identifier
The syntax of the vmid
[protocol:][//]lvmid[@hostname[:port]/servername]
protocolThe communications protocol. If the protocol value is omitted and a host name is not specified, then the default protocol is a platform-specific optimized local protocol. If the protocol value is omitted and a host name is specified, then the default protocol is rmi.lvmidThe local virtual machine identifier for the target JVM. The lvmid is a platform-specific value that uniquely identifies a JVM on a system. The lvmid is the only required component of a virtual machine identifier. The lvmid is typically, but not necessarily, the operating system's process identifier for the target JVM process. You can use the jps command to determine the lvmid. Also, you can determine the lvmid on Solaris, Linux, and OS X platforms with the pshostname
A hostname or IP address that indicates the target host. If the hostname value is omitted, then the target host is the local host.
portThe default port for communicating with the remote server. If the hostname value is omitted or the protocol value specifies an optimized, local protocol, then the port value is ignored. Otherwise, treatment of the port parameter is implementation-specific. For the default rmi protocol, the port value indicates the port number for the rmiregistry on the remote host. If the port value is omitted and the protocol value indicates rmi, then the default rmiregistry port (1099) is used.servernameThe treatment of the servername parameter depends on implementation. For the optimized local protocol, this field is ignored. For the rmi
Options
The jstat command supports two types of options, general options and output options. General options cause the jstat
All options and their functionality are subject to change or removal in future releases.
General Options
If you specify one of the general options, then you cannot specify any other option or parameter.
-help
Displays a help message.
-options
Displays a list of static options. See Output Options.
Output Options
If you do not specify a general option, then you can specify output options. Output options determine the content and format of the jstat command's output, and consist of a single statOption, plus any of the other output options (-h, -t, and -J). The statOptionOutput is formatted as a table, with columns that are separated by spaces. A header row with titles describes the columns. Use the -hUse the -tUse the interval and count parameters to determine how frequently and how many times, respectively, the jstatNote: Do not to write scripts to parse the jstat command's output because the format might change in future releases. If you write scripts that parse jstat
-statOptionDetermines the statistics information the jstat command displays. The following lists the available options. Use the -options general option to display the list of options for a particular platform installation. See Stat Options and Output.class: Displays statistics about the behavior of the class loader.compiler: Displays statistics about the behavior of the Java HotSpot VM Just-in-Time compiler.gc: Displays statistics about the behavior of the garbage collected heap.gccapacity: Displays statistics about the capacities of the generations and their corresponding spaces.gccause: Displays a summary about garbage collection statistics (same as -gcutil), with the cause of the last and current (when applicable) garbage collection events.gcnew: Displays statistics of the behavior of the new generation.gcnewcapacity: Displays statistics about the sizes of the new generations and its corresponding spaces.gcold: Displays statistics about the behavior of the old generation and metaspace statistics.gcoldcapacity: Displays statistics about the sizes of the old generation.gcmetacapacity: Displays statistics about the sizes of the metaspace.gcutil: Displays a summary about garbage collection statistics.printcompilation: Displays Java HotSpot VM compilation method statistics.
-h n
Displays a column header every n samples (output rows), where n is a positive integer. Default value is 0, which displays the column header the first row of data.
-t
Displays a timestamp column as the first column of output. The time stamp is the time since the start time of the target JVM.
-JjavaOptionPasses javaOption to the Java application launcher. For example, -J-Xms48m sets the startup memory to 48 MB. For a complete list of options, see java(1).
Stat Options and Output
The following information summarizes the columns that the jstat command outputs for each statOption.
-class option
Class loader statistics.
Loaded: Number of classes loaded.Bytes: Number of kBs loaded.Unloaded: Number of classes unloaded.Bytes: Number of Kbytes unloaded.Time: Time spent performing class loading and unloading operations.
-compiler option
Java HotSpot VM Just-in-Time compiler statistics.
Compiled: Number of compilation tasks performed.Failed: Number of compilations tasks failed.Invalid: Number of compilation tasks that were invalidated.Time: Time spent performing compilation tasks.FailedType: Compile type of the last failed compilation.FailedMethod: Class name and method of the last failed compilation.
-gc option
Garbage-collected heap statistics.
S0C: Current survivor space 0 capacity (kB).S1C: Current survivor space 1 capacity (kB).S0U: Survivor space 0 utilization (kB).S1U: Survivor space 1 utilization (kB).EC: Current eden space capacity (kB).EU: Eden space utilization (kB).OC: Current old space capacity (kB).OU: Old space utilization (kB).MC: Metaspace capacity (kB).MU: Metacspace utilization (kB).CCSC: Compressed class space capacity (kB).CCSU: Compressed class space used (kB).YGC: Number of young generation garbage collection events.YGCT: Young generation garbage collection time.FGC: Number of full GC events.FGCT: Full garbage collection time.GCT: Total garbage collection time.
-gccapacity option
Memory pool generation and space capacities.
NGCMN: Minimum new generation capacity (kB).NGCMX: Maximum new generation capacity (kB).NGC: Current new generation capacity (kB).S0C: Current survivor space 0 capacity (kB).S1C: Current survivor space 1 capacity (kB).EC: Current eden space capacity (kB).OGCMN: Minimum old generation capacity (kB).OGCMX: Maximum old generation capacity (kB).OGC: Current old generation capacity (kB).OC: Current old space capacity (kB).MCMN: Minimum metaspace capacity (kB).MCMX: Maximum metaspace capacity (kB).MC: Metaspace capacity (kB).CCSMN: Compressed class space minimum capacity (kB).CCSMX: Compressed class space maximum capacity (kB).CCSC: Compressed class space capacity (kB).YGC: Number of young generation GC events.FGC: Number of full GC events.
-gccause optionThis option displays the same summary of garbage collection statistics as the -gcutil option, but includes the causes of the last garbage collection event and (when applicable) the current garbage collection event. In addition to the columns listed for -gcutil, this option adds the following columns.LGCC: Cause of last garbage collectionGCC: Cause of current garbage collection
-gcnew option
New generation statistics.
S0C: Current survivor space 0 capacity (kB).S1C: Current survivor space 1 capacity (kB).S0U: Survivor space 0 utilization (kB).S1U: Survivor space 1 utilization (kB).TT: Tenuring threshold.MTT: Maximum tenuring threshold.DSS: Desired survivor size (kB).EC: Current eden space capacity (kB).EU: Eden space utilization (kB).YGC: Number of young generation GC events.YGCT: Young generation garbage collection time.
-gcnewcapacity option
New generation space size statistics.
NGCMN: Minimum new generation capacity (kB).NGCMX: Maximum new generation capacity (kB).NGC: Current new generation capacity (kB).S0CMX: Maximum survivor space 0 capacity (kB).S0C: Current survivor space 0 capacity (kB).S1CMX: Maximum survivor space 1 capacity (kB).S1C: Current survivor space 1 capacity (kB).ECMX: Maximum eden space capacity (kB).EC: Current eden space capacity (kB).YGC: Number of young generation GC events.FGC: Number of full GC events.
-gcold option
Old generation and metaspace behavior statistics.
MC: Metaspace capacity (kB).MU: Metaspace utilization (kB).CCSC: Compressed class space capacity (kB).CCSU: Compressed class space used (kB).OC: Current old space capacity (kB).OU: Old space utilization (kB).YGC: Number of young generation GC events.FGC: Number of full GC events.FGCT: Full garbage collection time.GCT: Total garbage collection time.
-gcoldcapacity option
Old generation size statistics.
OGCMN: Minimum old generation capacity (kB).OGCMX: Maximum old generation capacity (kB).OGC: Current old generation capacity (kB).OC: Current old space capacity (kB).YGC: Number of young generation GC events.FGC: Number of full GC events.FGCT: Full garbage collection time.GCT: Total garbage collection time.
-gcmetacapacity option
Metaspace size statistics.
MCMN: Minimum metaspace capacity (kB).MCMX: Maximum metaspace capacity (kB).MC: Metaspace capacity (kB).CCSMN: Compressed class space minimum capacity (kB).CCSMX: Compressed class space maximum capacity (kB).YGC: Number of young generation GC events.FGC: Number of full GC events.FGCT: Full garbage collection time.GCT: Total garbage collection time.
-gcutil option
Summary of garbage collection statistics.
S0: Survivor space 0 utilization as a percentage of the space's current capacity.S1: Survivor space 1 utilization as a percentage of the space's current capacity.E: Eden space utilization as a percentage of the space's current capacity.O: Old space utilization as a percentage of the space's current capacity.M: Metaspace utilization as a percentage of the space's current capacity.CCS: Compressed class space utilization as a percentage.YGC: Number of young generation GC events.YGCT: Young generation garbage collection time.FGC: Number of full GC events.FGCT: Full garbage collection time.GCT: Total garbage collection time.
-printcompilation option
Java HotSpot VM compiler method statistics.
Compiled: Number of compilation tasks performed by the most recently compiled method.Size: Number of bytes of byte code of the most recently compiled method.Type: Compilation type of the most recently compiled method.Method: Class name and method name identifying the most recently compiled method. Class name uses slash (/) instead of dot (.) as a name space separator. Method name is the method within the specified class. The format for these two fields is consistent with the HotSpot -XX:+PrintCompilation
Examples
This section presents some examples of monitoring a local JVM with an lvmid of 21891.
The gcutil Option
This example attaches to lvmid 21891 and takes 7 samples at 250 millisecond intervals and displays the output as specified by the -gcutil
The output of this example shows that a young generation collection occurred between the third and fourth sample. The collection took 0.078 seconds and promoted objects from the eden space (E) to the old space (O), resulting in an increase of old space utilization from 66.80% to 68.19%. Before the collection, the survivor space was 97.02% utilized, but after this collection it is 91.03% utilized.
jstat -gcutil 21891 250 7
  S0     S1     E      O      M     CCS    YGC     YGCT    FGC    FGCT     GCT
  0.00  97.02  70.31  66.80  95.52  89.14      7    0.300     0    0.000    0.300
  0.00  97.02  86.23  66.80  95.52  89.14      7    0.300     0    0.000    0.300
  0.00  97.02  96.53  66.80  95.52  89.14      7    0.300     0    0.000    0.300
 91.03   0.00   1.98  68.19  95.89  91.24      8    0.378     0    0.000    0.378
 91.03   0.00  15.82  68.19  95.89  91.24      8    0.378     0    0.000    0.378
 91.03   0.00  17.80  68.19  95.89  91.24      8    0.378     0    0.000    0.378
 91.03   0.00  17.80  68.19  95.89  91.24      8    0.378     0    0.000    0.378
Repeat the Column Header String
This example attaches to lvmid 21891 and takes samples at 250 millisecond intervals and displays the output as specified by -gcnew option. In addition, it uses the -h3
In addition to showing the repeating header string, this example shows that between the second and third samples, a young GC occurred. Its duration was 0.001 seconds. The collection found enough active data that the survivor space 0 utilization (S0U) would have exceeded the desired survivor Size (DSS). As a result, objects were promoted to the old generation (not visible in this output), and the tenuring threshold (TT) was lowered from 31 to 2.
Another collection occurs between the fifth and sixth samples. This collection found very few survivors and returned the tenuring threshold to 31.
jstat -gcnew -h3 21891 250
 S0C    S1C    S0U    S1U   TT MTT  DSS      EC       EU     YGC     YGCT
  64.0   64.0    0.0   31.7 31  31   32.0    512.0    178.6    249    0.203
  64.0   64.0    0.0   31.7 31  31   32.0    512.0    355.5    249    0.203
  64.0   64.0   35.4    0.0  2  31   32.0    512.0     21.9    250    0.204
 S0C    S1C    S0U    S1U   TT MTT  DSS      EC       EU     YGC     YGCT
  64.0   64.0   35.4    0.0  2  31   32.0    512.0    245.9    250    0.204
  64.0   64.0   35.4    0.0  2  31   32.0    512.0    421.1    250    0.204
  64.0   64.0    0.0   19.0 31  31   32.0    512.0     84.4    251    0.204
 S0C    S1C    S0U    S1U   TT MTT  DSS      EC       EU     YGC     YGCT
  64.0   64.0    0.0   19.0 31  31   32.0    512.0    306.7    251    0.204
Include a Time Stamp for Each Sample
This example attaches to lvmid 21891 and takes 3 samples at 250 millisecond intervals. The -tThe Timestamp column reports the elapsed time in seconds since the start of the target JVM. In addition, the -gcoldcapacity
Timestamp      OGCMN    OGCMX     OGC       OC       YGC   FGC    FGCT    GCT
          150.1   1408.0  60544.0  11696.0  11696.0   194    80    2.874   3.799
          150.4   1408.0  60544.0  13820.0  13820.0   194    81    2.938   3.863
          150.7   1408.0  60544.0  13820.0  13820.0   194    81    2.938   3.863
Monitor Instrumentation for a Remote JVM
This example attaches to lvmid 40496 on the system named remote.domain using the -gcutilThe lvmid is combined with the name of the remote host to construct a vmid of 40496@remote.domain. This vmid results in the use of the rmi protocol to communicate to the default jstatd server on the remote host. The jstatd server is located using the rmiregistry command on remote.domain that is bound to the default port of the rmiregistry
jstat -gcutil 40496@remote.domain 1000
... output omitted
See Also
java(1)
jps(1)
jstatd(1)
rmiregistry(1)
https://docs.oracle.com/javase/8/docs/technotes/tools/unix/jstat.html


