
摘要
本文主要根据对Airbnb 新用户的民宿预定结果进行预测,完整的陈述了从 数据探索到 特征工程到 构建模型的整个过程。
其中: 1数据探索部分主要基于 pandas库,利用常见的: head(), value_counts(), describe(), isnull(), unique()等函数以及通过 matplotlib作图对数据进行理解和探索; 2.特征工程部分主要是通过从日期中提取 年月日, 季节, weekday,对年龄进行 分段,计算相关特征之间的 差值,根据用户id进行分组,从而统计一些特征变量的 次数, 平均值, 标准差等等,以及通过 one hot encoding和 labels encoding对数据进行编码来提取特征; 3.构建模型部分主要基于 sklearn包, xgboost包,通过调用不同的模型进行预测,其中涉及到的模型有,逻辑回归模型 LogisticRegression,树模型: DecisionTree,RandomForest,AdaBoost,Bagging,ExtraTree,GraBoost,SVM模型: SVM-rbf,SVM-poly,SVM-linear, xgboost,以及通过改变 模型的参数和 数据量大小,来观察 NDGG的评分结果,从而了解不同模型,不同参数和不同数据量大小对预测结果的影响.
1. 背景
About this Dataset,In this challenge, you are given a list of users along with their demographics, web session records, and some summary statistics. You are asked to predict which country a new user's first booking destination will be. All the users in this dataset are from the USA.
There are 12 possible outcomes of the destination country: 'US', 'FR', 'CA', 'GB', 'ES', 'IT', 'PT', 'NL','DE', 'AU', 'NDF' (no destination found), and 'other'. Please note that 'NDF' is different from 'other' because 'other' means there was a booking, but is to a country not included in the list, while 'NDF' means there wasn't a booking.
2. 数据描述
总共包含6个csv文件
- trainusers2.csv - the training set of users (训练数据)
- testusers.csv - the test set of users (测试数据)
- id: user id (用户id)
- dateaccountcreated(帐号注册时间): the date of account creation
- timestampfirstactive(首次活跃时间): timestamp of the first activity, note that it can be earlier than dateaccountcreated or datefirstbooking because a user can search before signing up
- datefirstbooking(首次订房时间): date of first booking
- gender(性别)
- age(年龄)
- signupmethod(注册方式)
- signupflow(注册页面): the page a user came to signup up from
- language(语言): international language preference
- affiliatechannel(付费市场渠道): what kind of paid marketing
- affiliateprovider(付费市场渠道名称): where the marketing is e.g. google, craigslist, other
affiliate
- signupapp(注册app)
- firstdevicetype(设备类型)
- firstbrowser(浏览器类型)
- countrydestination(订房国家-需要预测的量): this is the target variable you are to predict
- sessions.csv - web sessions log for users(网页浏览数据)
- userid(用户id): to be joined with the column 'id' in users table
- action(用户行为)
- actiontype(用户行为类型)
- actiondetail(用户行为具体)
- devicetype(设备类型)
- secs_elapsed(停留时长)
- sample_submission.csv - correct format for submitting your predictions
- 数据下载地址 Airbnb 新用户的民宿预定预测-数据集
3. 数据探索
- 基于jupyter notebook 和 python3
3.1 trainusers2和test_users文件
读取文件
-
train = pd.read_csv("train_users_2.csv") -
test = pd.read_csv("test_users.csv")
导包
-
import numpy as np -
import pandas as pd -
import matplotlib.pyplot as plt -
import sklearn as sk -
%matplotlib inline -
import datetime -
import os -
import seaborn as sns#数据可视化 -
from datetime import date -
from sklearn.preprocessing import LabelEncoder -
from sklearn.preprocessing import StandardScaler -
from sklearn.preprocessing import LabelBinarizer -
import pickle #用于存储模型 -
import seaborn as sns -
from sklearn.metrics import * -
from sklearn.model_selection import *
查看数据包含的特征
-
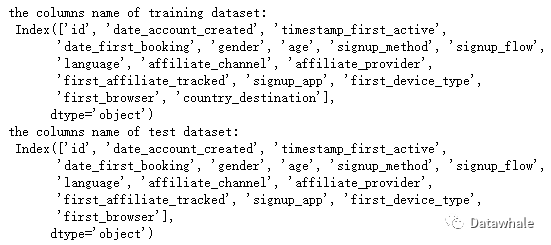
print('the columns name of training dataset:\n',train.columns) -
print('the columns name of test dataset:\n',test.columns)
分析:
- train文件比test文件多了特征-country_destination
- country_destination是需要预测的目标变量
- 数据探索时着重分析train文件,test文件类似
查看数据信息
-
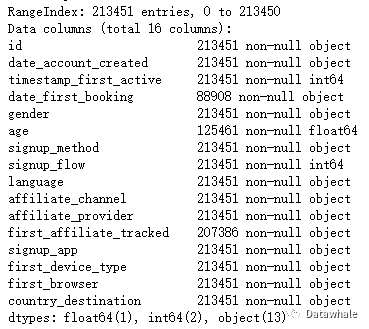
print(train.info())
 分析:
分析:
- trian文件包含213451行数据,16个特征
- 每个特征的数据类型和非空数值
- datefirstbooking空值较多,在特征提取时可以考虑删除
特征分析:1. dateaccountcreated
1.1 查看dateaccountcreated前几行数据
-
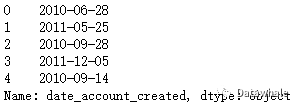
print(train.date_account_created.head())
1.2 对dateaccountcreated数据进行统计
-
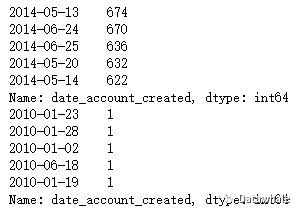
print(train.date_account_created.value_counts().head()) -
print(train.date_account_created.value_counts().tail())
1.3获取dateaccountcreated信息
-
print(train.date_account_created.describe())
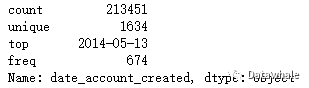
1.4观察用户增长情况
-
dac_train = train.date_account_created.value_counts() -
dac_test = test.date_account_created.value_counts() -
#将数据类型转换为datatime类型 -
dac_train_date = pd.to_datetime(train.date_account_created.value_counts().index) -
dac_test_date = pd.to_datetime(test.date_account_created.value_counts().index) -
#计算离首次注册时间相差的天数 -
dac_train_day = dac_train_date - dac_train_date.min() -
dac_test_day = dac_test_date - dac_train_date.min() -
#motplotlib作图 -
plt.scatter(dac_train_day.days, dac_train.values, color = 'r', label = 'train dataset') -
plt.scatter(dac_test_day.days, dac_test.values, color = 'b', label = 'test dataset') -
plt.title("Accounts created vs day") -
plt.xlabel("Days") -
plt.ylabel("Accounts created") -
plt.legend(loc = 'upper left')
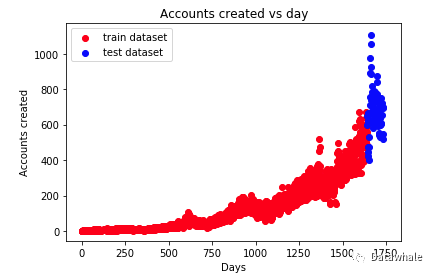 分析:
分析:
- x轴:离首次注册时间相差的天数
- y轴:当天注册的用户数量
- 随着时间的增长,用户注册的数量在急剧上升
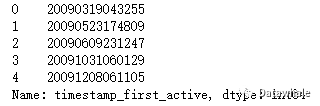
2. timestampfirstactive2.1查看头几行数据
-
print(train.timestamp_first_active.head())
2.2对数据进行统计看非重复值的数量
-
print(train.timestamp_first_active.value_counts().unique())
[1] 分析: 结果[1]表明timestampfirstactive没有重复数据
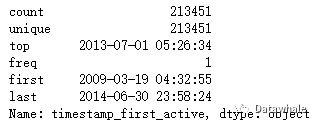
2.3将时间戳转成日期形式并获取数据信息
-
tfa_train_dt = train.timestamp_first_active.astype(str).apply(lambda x: -
datetime.datetime(int(x[:4]), -
int(x[4:6]), -
int(x[6:8]), -
int(x[8:10]), -
int(x[10:12]), -
int(x[12:]))) -
print(tfa_train_dt.describe())
3. datefirstbooking获取数据信息
-
print(train.date_first_booking.describe()) -
print(test.date_first_booking.describe())
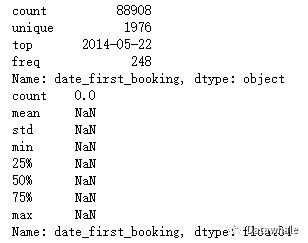 分析:
分析:
- train文件中datefirstbooking有大量缺失值
- test文件中datefirstbooking全是缺失值
- 可以删除特征datefirstbooking
4.age4.1对数据进行统计
-
print(train.age.value_counts().head())
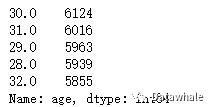 分析:用户年龄主要集中在30左右4.2柱状图统计
-
#首先将年龄进行分成4组missing values, too small age, reasonable age, too large age -
age_train =[train[train.age.isnull()].age.shape[0], -
train.query('age < 15').age.shape[0], -
train.query("age >= 15 & age <= 90").age.shape[0], -
train.query('age > 90').age.shape[0]] -
age_test = [test[test.age.isnull()].age.shape[0], -
test.query('age < 15').age.shape[0], -
test.query("age >= 15 & age <= 90").age.shape[0], -
test.query('age > 90').age.shape[0]] -
columns = ['Null', 'age < 15', 'age', 'age > 90'] -
# plot -
fig, (ax1,ax2) = plt.subplots(1,2,sharex=True, sharey = True,figsize=(10,5)) -
sns.barplot(columns, age_train, ax = ax1) -
sns.barplot(columns, age_test, ax = ax2) -
ax1.set_title('training dataset') -
ax2.set_title('test dataset') -
ax1.set_ylabel('counts')
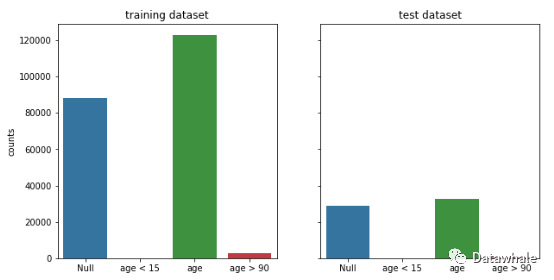 分析:异常年龄较少,且有一定数量的缺失值
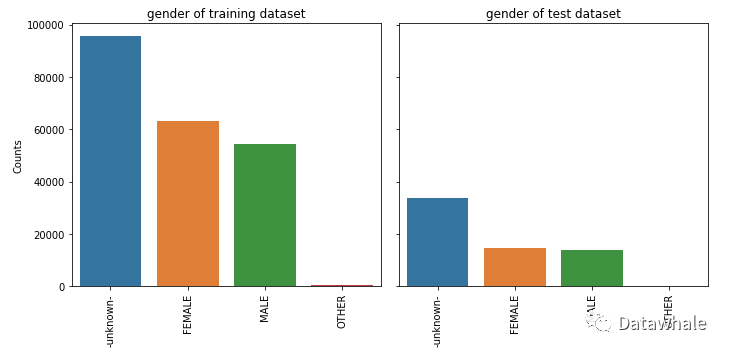
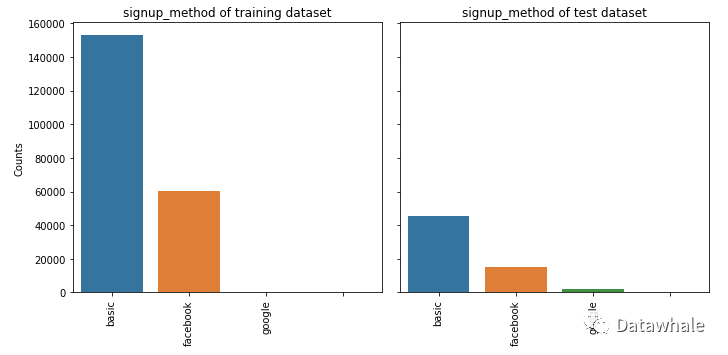
5.其他特征
- train文件中其他特征由于labels较少,我们可以在特征工程中直接进行one hot encoding即可
统一使用柱状图进行统计
-
def feature_barplot(feature, df_train = train, df_test = test, figsize=(10,5), rot = 90, saveimg = False): -
feat_train = df_train[feature].value_counts() -
feat_test = df_test[feature].value_counts() -
fig_feature, (axis1,axis2) = plt.subplots(1,2,sharex=True, sharey = True, figsize = figsize) -
sns.barplot(feat_train.index.values, feat_train.values, ax = axis1) -
sns.barplot(feat_test.index.values, feat_test.values, ax = axis2) -
axis1.set_xticklabels(axis1.xaxis.get_majorticklabels(), rotation = rot) -
axis2.set_xticklabels(axis1.xaxis.get_majorticklabels(), rotation = rot) -
axis1.set_title(feature + ' of training dataset') -
axis2.set_title(feature + ' of test dataset') -
axis1.set_ylabel('Counts') -
plt.tight_layout() -
if saveimg == True: -
figname = feature + ".png" -
fig_feature.savefig(figname, dpi = 75)
5.1 gender
-
feature_barplot('gender', saveimg = True)
 5.2 signup_method
-
feature_barplot('signup_method')
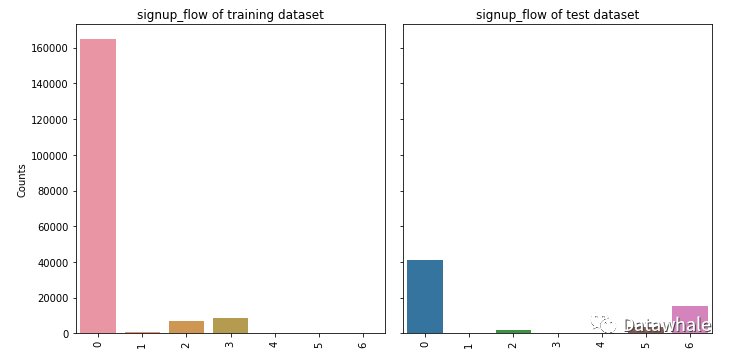
 5.3 signup_flow
-
feature_barplot('signup_flow')
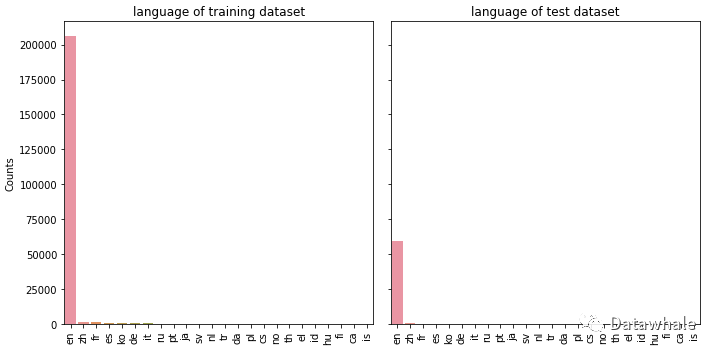
 5.4 language
-
feature_barplot('language')
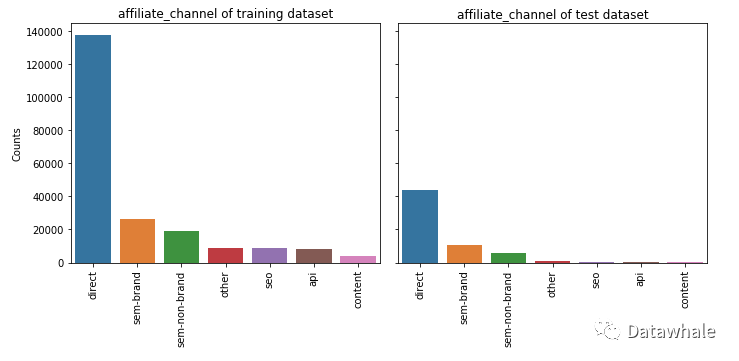
 5.5 affiliate_channel
-
feature_barplot('affiliate_channel')
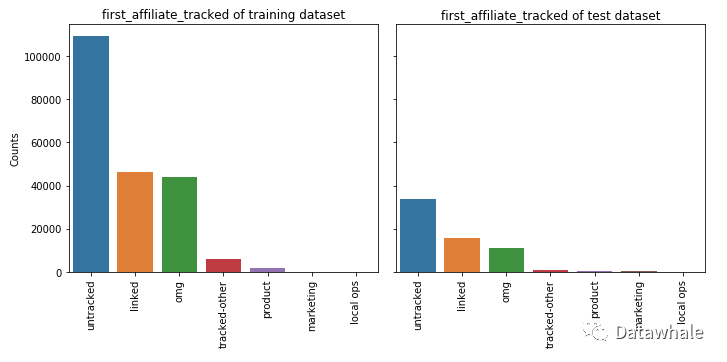
 5.6 firstaffiliatetracked
-
feature_barplot('first_affiliate_tracked')
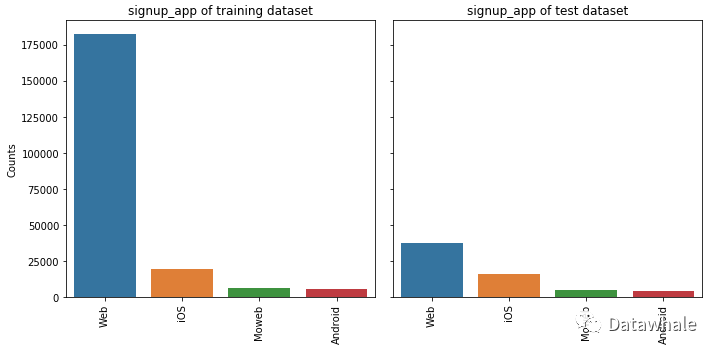
 5.7 signup_app
-
feature_barplot('signup_app')
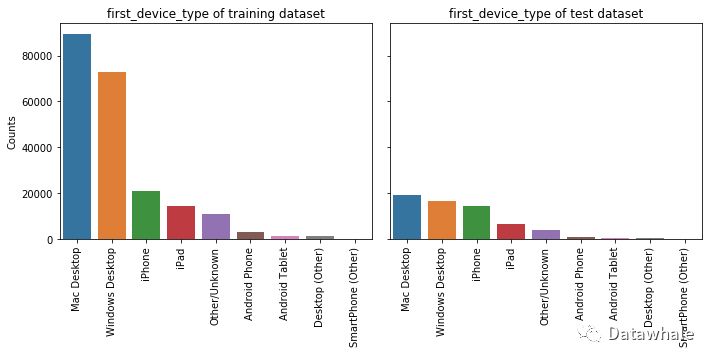
 5.8 firstdevicetype
-
feature_barplot('first_device_type')
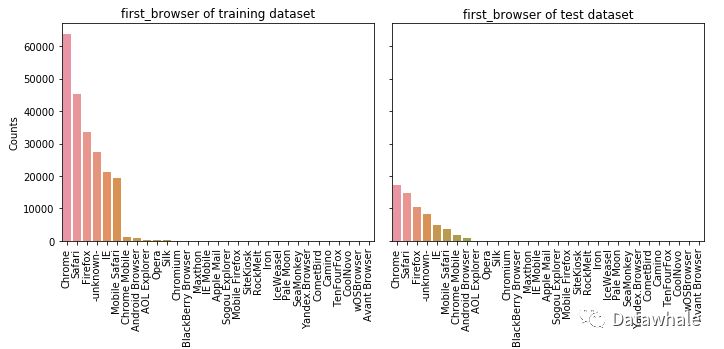
 5.9 first_browser
-
feature_barplot('first_browser')
3.2 sesion文件
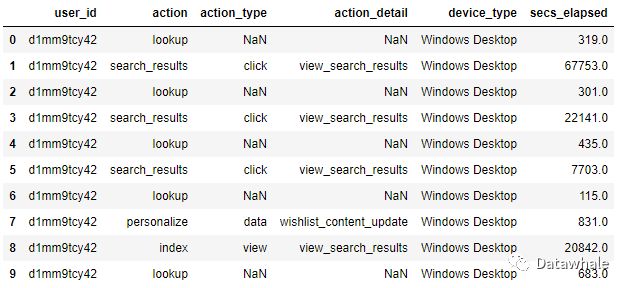
获取数据并查看头10行数据
-
df_sessions = pd.read_csv('sessions.csv') -
df_sessions.head(10)
 将user_id改名为id
-
#这是为了后面的数据合并 -
df_sessions['id'] = df_sessions['user_id'] -
df_sessions = df_sessions.drop(['user_id'],axis=1) #按行删除
查看数据的shape
-
df_sessions.shape
(10567737, 6) 分析:session文件有10567737行数据,6个特征
查看缺失值
-
df_sessions.isnull().sum()
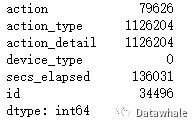 分析:action,actiontype,actiondetail, secs_elapsed缺失值较多
填充缺失值
-
df_sessions.action = df_sessions.action.fillna('NAN') -
df_sessions.action_type = df_sessions.action_type.fillna('NAN') -
df_sessions.action_detail = df_sessions.action_detail.fillna('NAN') -
df_sessions.isnull().sum()
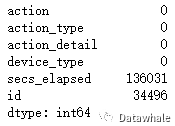 分析:
分析:
- 填充后缺失值已经为0了
- secs_elapsed 在后续做填充处理
4. 特征提取
- 在对数据有一定了解后,我们进行特征提取工作
4.1 对session文件特征提取
1.action
-
df_sessions.action.head()

-
df_sessions.action.value_counts().min()
1 分析:对action进行统计,我们可以发现用户action有多种,且最少的发生次数只有1,接下来我们可以对用户发生次数较少的行为列为OTHER一类
1.1 将特征action次数低于阈值100的列为OTHER
-
#Action values with low frequency are changed to 'OTHER' -
act_freq = 100 #Threshold of frequency -
act = dict(zip(*np.unique(df_sessions.action, return_counts=True))) -
df_sessions.action = df_sessions.action.apply(lambda x: 'OTHER' if act[x] < act_freq else x) -
#np.unique(df_sessions.action, return_counts=True) 取以数组形式返回非重复的action值和它的数量 -
#zip(*(a,b))a,b种元素一一对应,返回zip object
2. 对特征action,actiondetail,actiontype,devicetype,secselapsed进行细化
- 首先将用户的特征根据用户id进行分组
- 特征action:统计每个用户总的action出现的次数,各个action类型的数量,平均值以及标准差
- 特征actiondetail:统计每个用户总的actiondetail出现的次数,各个action_detail类型的数量,平均值以及标准差
- 特征actiontype:统计每个用户总的actiontype出现的次数,各个action_type类型的数量,平均值,标准差以及总的停留时长(进行log处理)
- 特征devicetype:统计每个用户总的devicetype出现的次数,各个device_type类型的数量,平均值以及标准差
- 特征secselapsed:对缺失值用0填充,统计每个用户secselapsed时间的总和,平均值,标准差以及中位数(进行log处理),(总和/平均数),secs_elapsed(log处理后)各个时间出现的次数
-
#对action特征进行细化 -
f_act = df_sessions.action.value_counts().argsort() -
f_act_detail = df_sessions.action_detail.value_counts().argsort() -
f_act_type = df_sessions.action_type.value_counts().argsort() -
f_dev_type = df_sessions.device_type.value_counts().argsort() -
#按照id进行分组 -
dgr_sess = df_sessions.groupby(['id']) -
#Loop on dgr_sess to create all the features. -
samples = [] #samples列表 -
ln = len(dgr_sess) #计算分组后df_sessions的长度 -
for g in dgr_sess: #对dgr_sess中每个id的数据进行遍历 -
gr = g[1] #data frame that comtains all the data for a groupby value 'zzywmcn0jv' -
l = [] #建一个空列表,临时存放特征 -
#the id for example:'zzywmcn0jv' -
l.append(g[0]) #将id值放入空列表中 -
# number of total actions -
l.append(len(gr))#将id对应数据的长度放入列表 -
#secs_elapsed 特征中的缺失值用0填充再获取具体的停留时长值 -
sev = gr.secs_elapsed.fillna(0).values #These values are used later. -
#action features 特征-用户行为 -
#每个用户行为出现的次数,各个行为类型的数量,平均值以及标准差 -
c_act = [0] * len(f_act) -
for i,v in enumerate(gr.action.values): #i是从0-1对应的位置,v 是用户行为特征的值 -
c_act[f_act[v]] += 1 -
_, c_act_uqc = np.unique(gr.action.values, return_counts=True) -
#计算用户行为行为特征各个类型数量的长度,平均值以及标准差 -
c_act += [len(c_act_uqc), np.mean(c_act_uqc), np.std(c_act_uqc)] -
l = l + c_act -
#action_detail features 特征-用户行为具体 -
#(how many times each value occurs, numb of unique values, mean and std) -
c_act_detail = [0] * len(f_act_detail) -
for i,v in enumerate(gr.action_detail.values): -
c_act_detail[f_act_detail[v]] += 1 -
_, c_act_det_uqc = np.unique(gr.action_detail.values, return_counts=True) -
c_act_detail += [len(c_act_det_uqc), np.mean(c_act_det_uqc), np.std(c_act_det_uqc)] -
l = l + c_act_detail -
#action_type features 特征-用户行为类型 click等 -
#(how many times each value occurs, numb of unique values, mean and std -
#+ log of the sum of secs_elapsed for each value) -
l_act_type = [0] * len(f_act_type) -
c_act_type = [0] * len(f_act_type) -
for i,v in enumerate(gr.action_type.values): -
l_act_type[f_act_type[v]] += sev[i] #sev = gr.secs_elapsed.fillna(0).values ,求每个行为类型总的停留时长 -
c_act_type[f_act_type[v]] += 1 -
l_act_type = np.log(1 + np.array(l_act_type)).tolist() #每个行为类型总的停留时长,差异比较大,进行log处理 -
_, c_act_type_uqc = np.unique(gr.action_type.values, return_counts=True) -
c_act_type += [len(c_act_type_uqc), np.mean(c_act_type_uqc), np.std(c_act_type_uqc)] -
l = l + c_act_type + l_act_type -
#device_type features 特征-设备类型 -
#(how many times each value occurs, numb of unique values, mean and std) -
c_dev_type = [0] * len(f_dev_type) -
for i,v in enumerate(gr.device_type .values): -
c_dev_type[f_dev_type[v]] += 1 -
c_dev_type.append(len(np.unique(gr.device_type.values))) -
_, c_dev_type_uqc = np.unique(gr.device_type.values, return_counts=True) -
c_dev_type += [len(c_dev_type_uqc), np.mean(c_dev_type_uqc), np.std(c_dev_type_uqc)] -
l = l + c_dev_type -
#secs_elapsed features 特征-停留时长 -
l_secs = [0] * 5 -
l_log = [0] * 15 -
if len(sev) > 0: -
#Simple statistics about the secs_elapsed values. -
l_secs[0] = np.log(1 + np.sum(sev)) -
l_secs[1] = np.log(1 + np.mean(sev)) -
l_secs[2] = np.log(1 + np.std(sev)) -
l_secs[3] = np.log(1 + np.median(sev)) -
l_secs[4] = l_secs[0] / float(l[1]) # -
#Values are grouped in 15 intervals. Compute the number of values -
#in each interval. -
#sev = gr.secs_elapsed.fillna(0).values -
log_sev = np.log(1 + sev).astype(int) -
#np.bincount():Count number of occurrences of each value in array of non-negative ints. -
l_log = np.bincount(log_sev, minlength=15).tolist() -
l = l + l_secs + l_log -
#The list l has the feature values of one sample. -
samples.append(l) -
#preparing objects -
samples = np.array(samples) -
samp_ar = samples[:, 1:].astype(np.float16) #取除id外的特征数据 -
samp_id = samples[:, 0] #取id,id位于第一列 -
#为提取的特征创建一个dataframe -
col_names = [] #name of the columns -
for i in range(len(samples[0])-1): #减1的原因是因为有个id -
col_names.append('c_' + str(i)) #起名字的方式 -
df_agg_sess = pd.DataFrame(samp_ar, columns=col_names) -
df_agg_sess['id'] = samp_id -
df_agg_sess.index = df_agg_sess.id #将id作为index -
df_agg_sess.head()
 分析:经过特征提取后,session文件由6个特征变为458个特征
4.2 对trian和test文件进行特征提取
标记train文件的行数和存储我们进行预测的目标变量
- labels存储了我们进行预测的目标变量country_destination
-
train = pd.read_csv("train_users_2.csv") -
test = pd.read_csv("test_users.csv") -
#计算出train的行数,便于之后对train和test数据进行分离操作 -
train_row = train.shape[0] -
# The label we need to predict -
labels = train['country_destination'].values
删除datefirstbooking和train文件中的country_destination
- 数据探索时我们发现datefirstbooking在train和test文件中缺失值太多,故删除
- 删除countrydestination,用模型预测countrydestination,再与已经存储country_destination的labels进行比较,从而判断模型优劣
-
train.drop(['country_destination', 'date_first_booking'], axis = 1, inplace = True) -
test.drop(['date_first_booking'], axis = 1, inplace = True)
合并train和test文件
- 便于进行相同的特征提取操作
-
#连接test 和 train -
df = pd.concat([train, test], axis = 0, ignore_index = True)
1. timestampfirstactive1.1 转换为datetime类型
-
tfa = df.timestamp_first_active.astype(str).apply(lambda x: datetime.datetime(int(x[:4]), -
int(x[4:6]), -
int(x[6:8]), -
int(x[8:10]), -
int(x[10:12]), -
int(x[12:])))
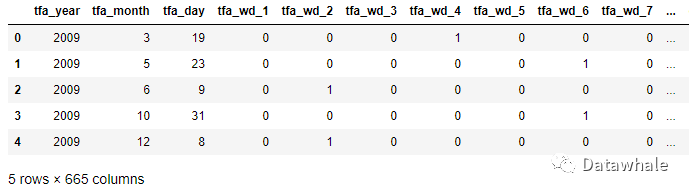
1.2 提取特征:年,月,日
-
# create tfa_year, tfa_month, tfa_day feature -
df['tfa_year'] = np.array([x.year for x in tfa]) -
df['tfa_month'] = np.array([x.month for x in tfa]) -
df['tfa_day'] = np.array([x.day for x in tfa])
1.3 提取特征:weekday
- 对结果进行one hot encoding编码
-
#isoweekday() 可以返回一周的星期几,e.g.星期日:0;星期一:1 -
df['tfa_wd'] = np.array([x.isoweekday() for x in tfa]) -
df_tfa_wd = pd.get_dummies(df.tfa_wd, prefix = 'tfa_wd') # one hot encoding -
df = pd.concat((df, df_tfa_wd), axis = 1) #添加df['tfa_wd'] 编码后的特征 -
df.drop(['tfa_wd'], axis = 1, inplace = True)#删除原有未编码的特征
1.4 提取特征:季节
- 因为判断季节关注的是月份,故对年份进行统一
-
Y = 2000 -
seasons = [(0, (date(Y, 1, 1), date(Y, 3, 20))), #'winter' -
(1, (date(Y, 3, 21), date(Y, 6, 20))), #'spring' -
(2, (date(Y, 6, 21), date(Y, 9, 22))), #'summer' -
(3, (date(Y, 9, 23), date(Y, 12, 20))), #'autumn' -
(0, (date(Y, 12, 21), date(Y, 12, 31)))] #'winter' -
def get_season(dt): -
dt = dt.date() #获取日期 -
dt = dt.replace(year=Y) #将年统一换成2000年 -
return next(season for season, (start, end) in seasons if start <= dt <= end) -
df['tfa_season'] = np.array([get_season(x) for x in tfa]) -
df_tfa_season = pd.get_dummies(df.tfa_season, prefix = 'tfa_season') # one hot encoding -
df = pd.concat((df, df_tfa_season), axis = 1) -
df.drop(['tfa_season'], axis = 1, inplace = True)
2. dateaccountcreated2.1 将dateaccountcreated转换为datetime类型
-
dac = pd.to_datetime(df.date_account_created)
2.2 提取特征:年,月,日
-
# create year, month, day feature for dac -
df['dac_year'] = np.array([x.year for x in dac]) -
df['dac_month'] = np.array([x.month for x in dac]) -
df['dac_day'] = np.array([x.day for x in dac])
2.3 提取特征:weekday
-
# create features of weekday for dac -
df['dac_wd'] = np.array([x.isoweekday() for x in dac]) -
df_dac_wd = pd.get_dummies(df.dac_wd, prefix = 'dac_wd') -
df = pd.concat((df, df_dac_wd), axis = 1) -
df.drop(['dac_wd'], axis = 1, inplace = True)
2.4 提取特征:季节
-
# create season features fro dac -
df['dac_season'] = np.array([get_season(x) for x in dac]) -
df_dac_season = pd.get_dummies(df.dac_season, prefix = 'dac_season') -
df = pd.concat((df, df_dac_season), axis = 1) -
df.drop(['dac_season'], axis = 1, inplace = True)
2.5提取特征:dateaccountcreated和timestampfirstactive之间的差值
- 即用户在airbnb平台活跃到正式注册所花的时间
-
dt_span = dac.subtract(tfa).dt.days
- dt_span的头十行数据
-
dt_span.value_counts().head(10)
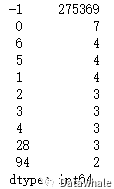 分析:数据主要集中在-1,可以猜测,用户当天注册dt_span值便是-1
- 从差值提取特征:差值为一天,一月,一年和其他
- 即用户活跃到注册花费的时间为一天,一月,一年或其他
-
# create categorical feature: span = -1; -1 < span < 30; 31 < span < 365; span > 365 -
def get_span(dt): -
# dt is an integer -
if dt == -1: -
return 'OneDay' -
elif (dt < 30) & (dt > -1): -
return 'OneMonth' -
elif (dt >= 30) & (dt <= 365): -
return 'OneYear' -
else: -
return 'other' -
df['dt_span'] = np.array([get_span(x) for x in dt_span]) -
df_dt_span = pd.get_dummies(df.dt_span, prefix = 'dt_span') -
df = pd.concat((df, df_dt_span), axis = 1) -
df.drop(['dt_span'], axis = 1, inplace = True)
2.6 删除原有的特征
- 对timestampfirstactive,dateaccountcreated进行特征提取后,从特征列表中删除原有的特征
-
df.drop(['date_account_created','timestamp_first_active'], axis = 1, inplace = True)
3. age
-
#Age 获取年龄 -
av = df.age.values
- 在数据探索阶段,我们发现大部分数据是集中在(15,90)区间的,但有部分年龄分布在(1900,2000)区间,我们猜测用户是把出生日期误填为年龄,故进行预处理
-
#This are birthdays instead of age (estimating age by doing 2014 - value) -
#数据来自2014年,故用2014-value -
av = np.where(np.logical_and(av<2000, av>1900), 2014-av, av) -
df['age'] = av
3.1 将年龄进行分段
age = df.age
-
age.fillna(-1, inplace = True) #空值填充为-1 -
div = 15 -
def get_age(age): -
# age is a float number 将连续型转换为离散型 -
if age < 0: -
return 'NA' #表示是空值 -
elif (age < div): -
return div #如果年龄小于15岁,那么返回15岁 -
elif (age <= div * 2): -
return div*2 #如果年龄大于15小于等于30岁,则返回30岁 -
elif (age <= div * 3): -
return div * 3 -
elif (age <= div * 4): -
return div * 4 -
elif (age <= div * 5): -
return div * 5 -
elif (age <= 110): -
return div * 6 -
else: -
return 'Unphysical' #非正常年龄
- 将分段后的年龄作为新的特征放入特征列表中
-
df['age'] = np.array([get_age(x) for x in age]) -
df_age = pd.get_dummies(df.age, prefix = 'age') -
df = pd.concat((df, df_age), axis = 1) -
df.drop(['age'], axis = 1, inplace = True)
4. 其他特征
- 在数据探索时,我们发现剩余的特征lables都比较少,故不进一步进行特征提取,只进行one-hot-encoding处理
-
feat_toOHE = ['gender', -
'signup_method', -
'signup_flow', -
'language', -
'affiliate_channel', -
'affiliate_provider', -
'first_affiliate_tracked', -
'signup_app', -
'first_device_type', -
'first_browser'] -
#对其他特征进行one-hot-encoding处理 -
for f in feat_toOHE: -
df_ohe = pd.get_dummies(df[f], prefix=f, dummy_na=True) -
df.drop([f], axis = 1, inplace = True) -
df = pd.concat((df, df_ohe), axis = 1)
4.3 整合提取的所有特征
- 我们将对session以及train,test文件中提取的特征进行合并
-
#将对session提取的特征整合到一起 -
df_all = pd.merge(df, df_agg_sess, how='left') -
df_all = df_all.drop(['id'], axis=1) #删除id -
df_all = df_all.fillna(-2) #对没有sesssion data的特征进行缺失值处理 -
#加了一列,表示每一行总共有多少空值,这也作为一个特征 -
df_all['all_null'] = np.array([sum(r<0) for r in df_all.values])
5. 模型构建
5.1 数据准备
1. 将train和test数据进行分离操作
- train_row是之前记录的train数据行数
-
Xtrain = df_all.iloc[:train_row, :] -
Xtest = df_all.iloc[train_row:, :]
2. 将提取的特征生成csv文件
-
Xtrain.to_csv("Airbnb_xtrain_v2.csv") -
Xtest.to_csv("Airbnb_xtest_v2.csv") -
#labels.tofile():Write array to a file as text or binary (default) -
labels.tofile("Airbnb_ytrain_v2.csv", sep='\n', format='%s') #存放目标变量
- 读取特征文件
-
xtrain = pd.read_csv("Airbnb_xtrain_v2.csv",index_col=0) -
ytrain = pd.read_csv("Airbnb_ytrain_v2.csv", header=None) -
xtrain.head()
-
ytrain.head()
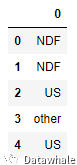 分析:可以发现经过特征提取后特征文件xtrain扩展为665个特征,ytrain中包含训练集中的目标变量3. 将目标变量进行labels encoding
-
le = LabelEncoder() -
ytrain_le = le.fit_transform(ytrain.values)
- labels encoding前: ['AU', 'CA', 'DE', 'ES', 'FR', 'GB', 'IT', 'NDF', 'NL', 'PT', 'US','other']
- labels encoding后: [0, 1, 2, 3, 4, 5, 6, 7, 8, 9, 10, 11]
4. 提取10%的数据进行模型训练
- 减少训练模型花费的时间
-
# Let us take 10% of the data for faster training. -
n = int(xtrain.shape[0]*0.1) -
xtrain_new = xtrain.iloc[:n, :] #训练数据 -
ytrain_new = ytrain_le[:n] #训练数据的目标变量
5. StandardScaling the dataset
- Standardization of a dataset is a common requirement for many machine learning estimators: they might behave badly if the individual feature do not more or less look like standard normally distributed data (e.g. Gaussian with 0 mean and unit variance)
-
X_scaler = StandardScaler() -
xtrain_new = X_scaler.fit_transform(xtrain_new)
5.2 评分模型:NDGG
- NDCG是一种衡量排序质量的评价指标,该指标考虑了所有元素的相关性
- 由于我们预测的目标变量并不是二分类变量,故我们用NDGG模型来进行模型评分,判断模型优劣
- 一般二分类变量: 我们习惯于使用 f1 score, precision, recall, auc score来进行模型评分
-
from sklearn.metrics import make_scorer -
def dcg_score(y_true, y_score, k=5): -
""" -
y_true : array, shape = [n_samples] #数据 -
Ground truth (true relevance labels). -
y_score : array, shape = [n_samples, n_classes] #预测的分数 -
Predicted scores. -
k : int -
""" -
order = np.argsort(y_score)[::-1] #分数从高到低排序 -
y_true = np.take(y_true, order[:k]) #取出前k[0,k)个分数 -
gain = 2 ** y_true - 1 -
discounts = np.log2(np.arange(len(y_true)) + 2) -
return np.sum(gain / discounts) -
def ndcg_score(ground_truth, predictions, k=5): -
""" -
Parameters -
---------- -
ground_truth : array, shape = [n_samples] -
Ground truth (true labels represended as integers). -
predictions : array, shape = [n_samples, n_classes] -
Predicted probabilities. 预测的概率 -
k : int -
Rank. -
""" -
lb = LabelBinarizer() -
lb.fit(range(len(predictions) + 1)) -
T = lb.transform(ground_truth) -
scores = [] -
# Iterate over each y_true and compute the DCG score -
for y_true, y_score in zip(T, predictions): -
actual = dcg_score(y_true, y_score, k) -
best = dcg_score(y_true, y_true, k) -
score = float(actual) / float(best) -
scores.append(score) -
return np.mean(scores)
6. 构建模型
6.1 Logistic Regression
-
from sklearn.linear_model import LogisticRegression -
from sklearn.model_selection import KFold -
from sklearn.model_selection import cross_val_score -
from sklearn.model_selection import train_test_split -
lr = LogisticRegression(C = 1.0, penalty='l2', multi_class='ovr') -
RANDOM_STATE = 2017 #随机种子 -
#k-fold cross validation(k-折叠交叉验证) -
kf = KFold(n_splits=5, random_state=RANDOM_STATE) #分成5个组 -
train_score = [] -
cv_score = [] -
# select a k (value how many y): -
k_ndcg = 3 -
# kf.split: Generate indices to split data into training and test set. -
for train_index, test_index in kf.split(xtrain_new, ytrain_new): -
#训练集数据分割为训练集和测试集,y是目标变量 -
X_train, X_test = xtrain_new[train_index, :], xtrain_new[test_index, :] -
y_train, y_test = ytrain_new[train_index], ytrain_new[test_index] -
lr.fit(X_train, y_train) -
y_pred = lr.predict_proba(X_test) -
train_ndcg_score = ndcg_score(y_train, lr.predict_proba(X_train), k = k_ndcg) -
cv_ndcg_score = ndcg_score(y_test, y_pred, k=k_ndcg) -
train_score.append(train_ndcg_score) -
cv_score.append(cv_ndcg_score) -
print ("\nThe training score is: {}".format(np.mean(train_score))) -
print ("\nThe cv score is: {}".format(np.mean(cv_score)))
The training score is: 0.7595244143892934 The cv score is: 0.7416926026958558
learning curve of logistic regression
- 观察逻辑回归模型学习曲线的变化 1. 改变逻辑回归参数iteration
-
# set the iterations -
iteration = [1,5,10,15,20, 50, 100] -
kf = KFold(n_splits=3, random_state=RANDOM_STATE) -
train_score = [] -
cv_score = [] -
# select a k: -
k_ndcg = 5 -
for i, item in enumerate(iteration): -
lr = LogisticRegression(C=1.0, max_iter=item, tol=1e-5, solver='newton-cg', multi_class='ovr') -
train_score_iter = [] -
cv_score_iter = [] -
for train_index, test_index in kf.split(xtrain_new, ytrain_new): -
X_train, X_test = xtrain_new[train_index, :], xtrain_new[test_index, :] -
y_train, y_test = ytrain_new[train_index], ytrain_new[test_index] -
lr.fit(X_train, y_train) -
y_pred = lr.predict_proba(X_test) -
train_ndcg_score = ndcg_score(y_train, lr.predict_proba(X_train), k = k_ndcg) -
cv_ndcg_score = ndcg_score(y_test, y_pred, k=k_ndcg) -
train_score_iter.append(train_ndcg_score) -
cv_score_iter.append(cv_ndcg_score) -
train_score.append(np.mean(train_score_iter)) -
cv_score.append(np.mean(cv_score_iter)) -
ymin = np.min(cv_score)-0.05 -
ymax = np.max(train_score)+0.05 -
plt.figure(figsize=(9,4)) -
plt.plot(iteration, train_score, 'ro-', label = 'training') -
plt.plot(iteration, cv_score, 'b*-', label = 'Cross-validation') -
plt.xlabel("iterations") -
plt.ylabel("Score") -
plt.xlim(-5, np.max(iteration)+10) -
plt.ylim(ymin, ymax) -
plt.plot(np.linspace(20,20,50), np.linspace(ymin, ymax, 50), 'g--') -
plt.legend(loc = 'lower right', fontsize = 12) -
plt.title("Score vs iteration learning curve") -
plt.tight_layout()
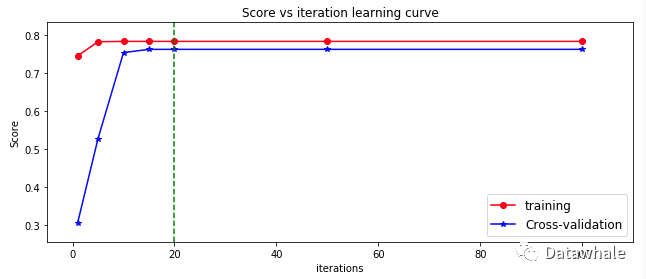 分析:随着iteration的增大,逻辑回归模型的评分在不断升高,当iteration超过20的时候,模型的评分基本不变
2. 改变数据量大小
-
# Chaning the sampling size -
# set the iter to the best iteration: iter = 20 -
perc = [0.01,0.02,0.05,0.1,0.2,0.5,1] -
kf = KFold(n_splits=3, random_state=RANDOM_STATE) -
train_score = [] -
cv_score = [] -
# select a k: -
k_ndcg = 5 -
for i, item in enumerate(perc): -
lr = LogisticRegression(C=1.0, max_iter=20, tol=1e-6, solver='newton-cg', multi_class='ovr') -
train_score_iter = [] -
cv_score_iter = [] -
n = int(xtrain_new.shape[0]*item) -
xtrain_perc = xtrain_new[:n, :] -
ytrain_perc = ytrain_new[:n] -
for train_index, test_index in kf.split(xtrain_perc, ytrain_perc): -
X_train, X_test = xtrain_perc[train_index, :], xtrain_perc[test_index, :] -
y_train, y_test = ytrain_perc[train_index], ytrain_perc[test_index] -
print(X_train.shape, X_test.shape) -
lr.fit(X_train, y_train) -
y_pred = lr.predict_proba(X_test) -
train_ndcg_score = ndcg_score(y_train, lr.predict_proba(X_train), k = k_ndcg) -
cv_ndcg_score = ndcg_score(y_test, y_pred, k=k_ndcg) -
train_score_iter.append(train_ndcg_score) -
cv_score_iter.append(cv_ndcg_score) -
train_score.append(np.mean(train_score_iter)) -
cv_score.append(np.mean(cv_score_iter)) -
ymin = np.min(cv_score)-0.1 -
ymax = np.max(train_score)+0.1 -
plt.figure(figsize=(9,4)) -
plt.plot(np.array(perc)*100, train_score, 'ro-', label = 'training') -
plt.plot(np.array(perc)*100, cv_score, 'bo-', label = 'Cross-validation') -
plt.xlabel("Sample size (unit %)") -
plt.ylabel("Score") -
plt.xlim(-5, np.max(perc)*100+10) -
plt.ylim(ymin, ymax) -
plt.legend(loc = 'lower right', fontsize = 12) -
plt.title("Score vs sample size learning curve") -
plt.tight_layout()
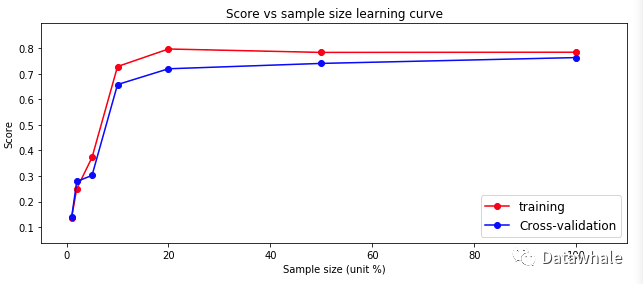 分析:随着数据量的增加,逻辑回归模型对测试集的预测评分(蓝色线)在不断上升,因为我们在训练模型时只用了10%的数据,如果使用全部的数据,效果可能会更好
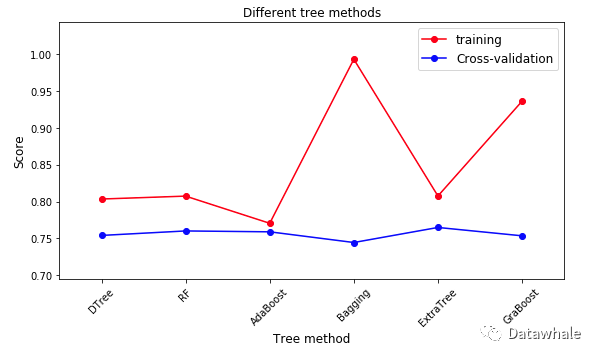
6.2 树模型
- 其中的模型包括DecisionTree,RandomForest,AdaBoost,Bagging,ExtraTree,GraBoost
-
from sklearn.ensemble import AdaBoostClassifier, BaggingClassifier, ExtraTreesClassifier -
from sklearn.ensemble import GradientBoostingClassifier, RandomForestClassifier -
from sklearn.tree import DecisionTreeClassifier -
from sklearn.ensemble import * -
from sklearn.svm import SVC, LinearSVC, NuSVC -
LEARNING_RATE = 0.1 -
N_ESTIMATORS = 50 -
RANDOM_STATE = 2017 -
MAX_DEPTH = 9 -
#建了一个tree字典 -
clf_tree ={ -
'DTree': DecisionTreeClassifier(max_depth=MAX_DEPTH, -
random_state=RANDOM_STATE), -
'RF': RandomForestClassifier(n_estimators=N_ESTIMATORS, -
max_depth=MAX_DEPTH, -
random_state=RANDOM_STATE), -
'AdaBoost': AdaBoostClassifier(n_estimators=N_ESTIMATORS, -
learning_rate=LEARNING_RATE, -
random_state=RANDOM_STATE), -
'Bagging': BaggingClassifier(n_estimators=N_ESTIMATORS, -
random_state=RANDOM_STATE), -
'ExtraTree': ExtraTreesClassifier(max_depth=MAX_DEPTH, -
n_estimators=N_ESTIMATORS, -
random_state=RANDOM_STATE), -
'GraBoost': GradientBoostingClassifier(learning_rate=LEARNING_RATE, -
max_depth=MAX_DEPTH, -
n_estimators=N_ESTIMATORS, -
random_state=RANDOM_STATE) -
} -
train_score = [] -
cv_score = [] -
kf = KFold(n_splits=3, random_state=RANDOM_STATE) -
k_ndcg = 5 -
for key in clf_tree.keys(): -
clf = clf_tree.get(key) -
train_score_iter = [] -
cv_score_iter = [] -
for train_index, test_index in kf.split(xtrain_new, ytrain_new): -
X_train, X_test = xtrain_new[train_index, :], xtrain_new[test_index, :] -
y_train, y_test = ytrain_new[train_index], ytrain_new[test_index] -
clf.fit(X_train, y_train) -
y_pred = clf.predict_proba(X_test) -
train_ndcg_score = ndcg_score(y_train, clf.predict_proba(X_train), k = k_ndcg) -
cv_ndcg_score = ndcg_score(y_test, y_pred, k=k_ndcg) -
train_score_iter.append(train_ndcg_score) -
cv_score_iter.append(cv_ndcg_score) -
train_score.append(np.mean(train_score_iter)) -
cv_score.append(np.mean(cv_score_iter)) -
train_score_tree = train_score -
cv_score_tree = cv_score -
ymin = np.min(cv_score)-0.05 -
ymax = np.max(train_score)+0.05 -
x_ticks = clf_tree.keys() -
plt.figure(figsize=(8,5)) -
plt.plot(range(len(x_ticks)), train_score_tree, 'ro-', label = 'training') -
plt.plot(range(len(x_ticks)),cv_score_tree, 'bo-', label = 'Cross-validation') -
plt.xticks(range(len(x_ticks)),x_ticks,rotation = 45, fontsize = 10) -
plt.xlabel("Tree method", fontsize = 12) -
plt.ylabel("Score", fontsize = 12) -
plt.xlim(-0.5, 5.5) -
plt.ylim(ymin, ymax) -
plt.legend(loc = 'best', fontsize = 12) -
plt.title("Different tree methods") -
plt.tight_layout()
6.3 SVM模型
- 根据核函数的不同,又分为:SVM-rbf,SVM-poly,SVM-linear等
-
TOL = 1e-4 -
MAX_ITER = 1000 -
clf_svm = { -
'SVM-rbf': SVC(kernel='rbf', -
max_iter=MAX_ITER, -
tol=TOL, random_state=RANDOM_STATE, -
decision_function_shape='ovr'), -
'SVM-poly': SVC(kernel='poly', -
max_iter=MAX_ITER, -
tol=TOL, random_state=RANDOM_STATE, -
decision_function_shape='ovr'), -
'SVM-linear': SVC(kernel='linear', -
max_iter=MAX_ITER, -
tol=TOL, -
random_state=RANDOM_STATE, -
decision_function_shape='ovr'), -
'LinearSVC': LinearSVC(max_iter=MAX_ITER, -
tol=TOL, -
random_state=RANDOM_STATE, -
multi_class = 'ovr') -
train_score_svm = [] -
cv_score_svm = [] -
kf = KFold(n_splits=3, random_state=RANDOM_STATE) -
k_ndcg = 5 -
for key in clf_svm.keys(): -
clf = clf_svm.get(key) -
train_score_iter = [] -
cv_score_iter = [] -
for train_index, test_index in kf.split(xtrain_new, ytrain_new): -
X_train, X_test = xtrain_new[train_index, :], xtrain_new[test_index, :] -
y_train, y_test = ytrain_new[train_index], ytrain_new[test_index] -
clf.fit(X_train, y_train) -
y_pred = clf.decision_function(X_test) -
train_ndcg_score = ndcg_score(y_train, clf.decision_function(X_train), k = k_ndcg) -
cv_ndcg_score = ndcg_score(y_test, y_pred, k=k_ndcg) -
train_score_iter.append(train_ndcg_score) -
cv_score_iter.append(cv_ndcg_score) -
train_score_svm.append(np.mean(train_score_iter)) -
cv_score_svm.append(np.mean(cv_score_iter)) -
} -
ymin = np.min(cv_score_svm)-0.05 -
ymax = np.max(train_score_svm)+0.05 -
x_ticks = clf_svm.keys() -
plt.figure(figsize=(8,5)) -
plt.plot(range(len(x_ticks)), train_score_svm, 'ro-', label = 'training') -
plt.plot(range(len(x_ticks)),cv_score_svm, 'bo-', label = 'Cross-validation') -
plt.xticks(range(len(x_ticks)),x_ticks,rotation = 45, fontsize = 10) -
plt.xlabel("Tree method", fontsize = 12) -
plt.ylabel("Score", fontsize = 12) -
plt.xlim(-0.5, 3.5) -
plt.ylim(ymin, ymax) -
plt.legend(loc = 'best', fontsize = 12) -
plt.title("Different SVM methods") -
plt.tight_layout()

6.4 xgboost
- kaggle比赛中常用的一个模型
-
import xgboost as xgb -
def customized_eval(preds, dtrain): -
labels = dtrain.get_label() -
top = [] -
for i in range(preds.shape[0]): -
top.append(np.argsort(preds[i])[::-1][:5]) -
mat = np.reshape(np.repeat(labels,np.shape(top)[1]) == np.array(top).ravel(),np.array(top).shape).astype(int) -
score = np.mean(np.sum(mat/np.log2(np.arange(2, mat.shape[1] + 2)),axis = 1)) -
return 'ndcg5', score -
# xgboost parameters -
NUM_XGB = 200 -
params = {} -
params['colsample_bytree'] = 0.6 -
params['max_depth'] = 6 -
params['subsample'] = 0.8 -
params['eta'] = 0.3 -
params['seed'] = RANDOM_STATE -
params['num_class'] = 12 -
params['objective'] = 'multi:softprob' # output the probability instead of class. -
train_score_iter = [] -
cv_score_iter = [] -
kf = KFold(n_splits = 3, random_state=RANDOM_STATE) -
k_ndcg = 5 -
for train_index, test_index in kf.split(xtrain_new, ytrain_new): -
X_train, X_test = xtrain_new[train_index, :], xtrain_new[test_index, :] -
y_train, y_test = ytrain_new[train_index], ytrain_new[test_index] -
train_xgb = xgb.DMatrix(X_train, label= y_train) -
test_xgb = xgb.DMatrix(X_test, label = y_test) -
watchlist = [ (train_xgb,'train'), (test_xgb, 'test') ] -
bst = xgb.train(params, -
train_xgb, -
NUM_XGB, -
watchlist, -
feval = customized_eval, -
verbose_eval = 3, -
early_stopping_rounds = 5) -
#bst = xgb.train( params, dtrain, num_round, evallist ) -
y_pred = np.array(bst.predict(test_xgb)) -
y_pred_train = np.array(bst.predict(train_xgb)) -
train_ndcg_score = ndcg_score(y_train, y_pred_train , k = k_ndcg) -
cv_ndcg_score = ndcg_score(y_test, y_pred, k=k_ndcg) -
train_score_iter.append(train_ndcg_score) -
cv_score_iter.append(cv_ndcg_score) -
train_score_xgb = np.mean(train_score_iter) -
cv_score_xgb = np.mean(cv_score_iter) -
print ("\nThe training score is: {}".format(train_score_xgb)) -
print ("The cv score is: {}\n".format(cv_score_xgb))
The training score is: 0.803445955699075 The cv score is: 0.7721491602424301
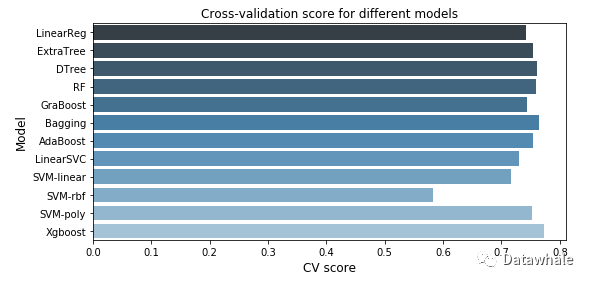
7. 模型比较
-
model_cvscore = np.hstack((cv_score_lr, cv_score_tree, cv_score_svm, cv_score_xgb)) -
model_name = np.array(['LinearReg','ExtraTree','DTree','RF','GraBoost','Bagging','AdaBoost','LinearSVC','SVM-linear','SVM-rbf','SVM-poly','Xgboost']) -
fig = plt.figure(figsize=(8,4)) -
sns.barplot(model_cvscore, model_name, palette="Blues_d") -
plt.xticks(rotation=0, size = 10) -
plt.xlabel("CV score", fontsize = 12) -
plt.ylabel("Model", fontsize = 12) -
plt.title("Cross-validation score for different models") -
plt.tight_layout()
8.总结
- 对数据的理解和探索很重要
- 可以通过特征工程,进一步提取特征
- 模型评估的方法有很多种,选取适宜的模型评估方法
- 目前只用了10%的数据进行模型训练,用全部的数据集进行训练,效果可能会更好
- 需要深入学习模型算法,学会调参


