为了更直观的了解prometheus如何工作,本文使用prometheus的python库来做一些相应的测试。
python库的github地址是
https://github.com/prometheus/client_python
根据提示,使用pip安装prometheus_client
pip3 install prometheus_client然后根据文档中的示例文件运行一个client
文件命名为prometheus_python_client.py
from prometheus_client import start_http_server, Summary
import random
import time
# Create a metric to track time spent and requests made.
REQUEST_TIME = Summary('request_processing_seconds', 'Time spent processing request')
# Decorate function with metric.
.time()
def process_request(t):
"""A dummy function that takes some time."""
time.sleep(t)
if __name__ == '__main__':
# Start up the server to expose the metrics.
start_http_server(8080)
# Generate some requests.
while True:
process_request(random.random())在后台运行client
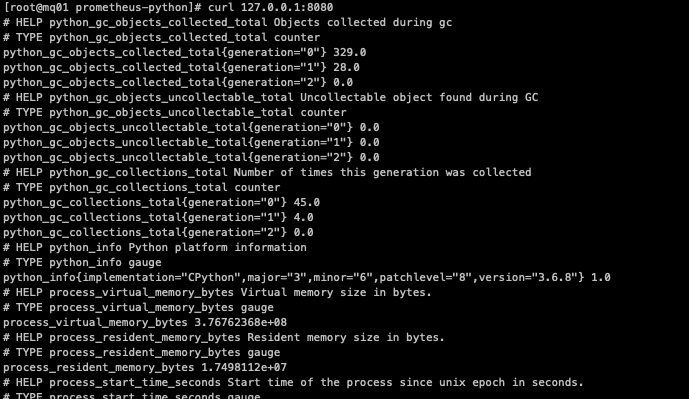
pytho3 prometheus_python_client.py &此时可以访问本机的8080端口,可以看到相应的metric
curl 127.0.0.1:8080/metrics得到如图所示结果
为了能监控到这个端口为8080的目标,需要在prometheus的配置文件prometheus.yml进行一些修改
在scrape_configs块部分加上一个新的job
scrape_configs
# The job name is added as a label `job=<job_name>` to any timeseries scraped from this config.
job_name"prometheus"
# metrics_path defaults to '/metrics'
# scheme defaults to 'http'.
static_configs
targets"localhost:9090"
job_name'python-client'
scrape_interval5s
static_configs
targets'localhost:8080'
labels
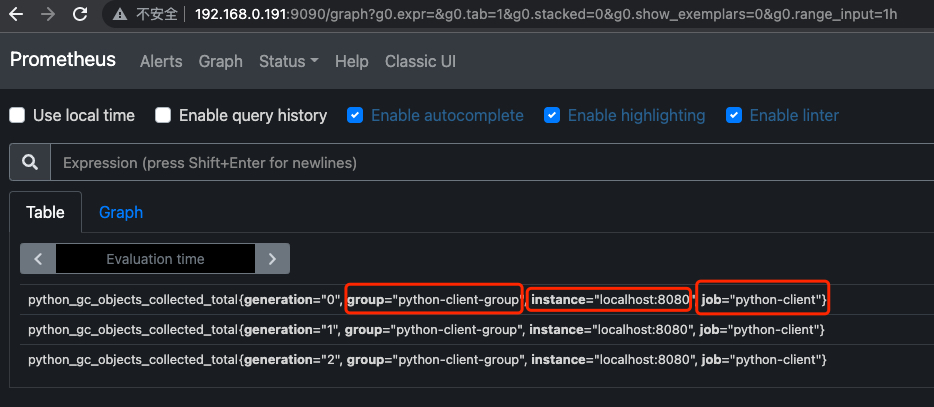
group'python-client-group'重启prometheus,并访问其web页面,在Expression中输入一个python client的metric并执行
可以看到对应的结果正如在scrape_configs中所配置的相一致。