【树莓派入门】实验二 Python 程序设计基础
一 实验原理
Python 程序可以有两种不同的运行/执行方式。
方法一:
- 通过桌面图标或开始菜单打开 IDLE3
- IDE 加载可能需要一点时间
- IDE 加载完成后会显示一个 Python shell 窗口
- 在 Python shell 窗口中键入如下命令
print(“Hello World”) - 按下回车键你将看到下方输出的 Hello World
方法二: - 通过桌面图标或开始菜单打开 IDLE3
- IDE 加载可能需要一点时间
- IDE 加载完成后会显示一个 Python shell 窗口
- 在 Python shell 窗口中,点击菜单项“文件”,点击下拉菜单中的
“新窗口”选项 - 在 4 中出现的新窗口里输入下面的代码
print(“Hello World”) - 保存文件并命名为 HelloWorld.py
- 打开 LXTerminal 然后输入下面的命令来执行文件里的程序
python HelloWorld.py
二 程序设计
实验中给的例题和代码都是基于Python2 的,但我们使用的版本是Python3,所以程序会经过更改
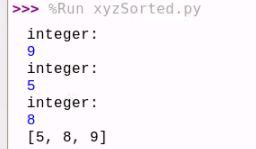
【程序 1】输入三个整数 x,y,z,请把这三个数由小到大输出。
1.1 程序分析:我们想办法把最小的数放到 x 上,先将 x 与 y 进行比较,如果
x>y 则将 x 与 y 的值进行交换,然后再用 x 与 z 进行比较,如果 x>z 则将 x 与 z
的值进行交换,这样能使 x 最小。
1.2 程序代码:
l = []
for i in range(3):
 x = int(raw_input('integer:\n'))
 l.append(x)
l.sort()
print l
更改后代码:
#xzySorted.py
l = []
for i in range(3):
 x = int(input('integer:\n'))
 l.append(x)
l.sort()
print (l)
运行结果:
【程序 2】打印楼梯,同时在楼梯上方打印两个笑脸。
2.1 程序分析:用 i 控制行,j 来控制列,j 根据 i 的变化来控制输出黑方格的
个数。
2.2 程序代码:
import sys
sys.stdout.write(chr(1))
sys.stdout.write(chr(1))
print ''
for i in range(1,11):
 for j in range(1,i):
 sys.stdout.write(chr(219))
 sys.stdout.write(chr(219))
 print ''
更改后代码:
#PrintStairs.py
import sys
sys.stdout.write(chr(1))
sys.stdout.write(chr(1))
print ('')
for i in range(1,11):
	for j in range(1,i):
		sys.stdout.write(chr(219))
		sys.stdout.write(chr(219))
 print ('')
运行结果:

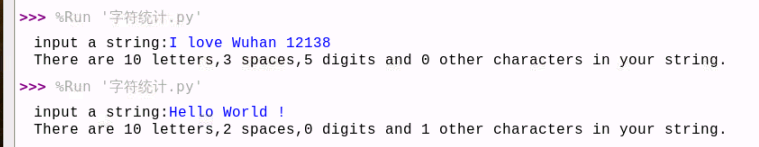
【程序 3】输入一行字符,分别统计出其中英文字母、空格、数字和其它字符的个数。
import string
def main():
 s = raw_input('input a string:')
 letter = 0
 space = 0
 digit = 0
 other = 0
 for c in s:
 if c.isalpha():
 letter+=1
 elif c.isspace():
 space+=1
 elif c.isdigit():
 digit+=1
 else:
 other+=1
 print 'There are %d letters,%d spaces,%d digits and %d
other characters in your string.'%(letter,space,digit,other)
if __name__ == '__main__':
 main()
更改后结果:
#字符统计.py
import string
def main():
    s = input('input a string:')
    letter = 0
    space = 0
    digit = 0
    other = 0
    for c in s:
        if c.isalpha():
            letter+=1
        elif c.isspace():
            space+=1
        elif c.isdigit():
            digit+=1
        else:
            other+=1
    print ('There are %d letters,%d spaces,%d digits and %d other characters in your string.'%(letter,space,digit,other))
if __name__ == '__main__':
    main()
运行结果:
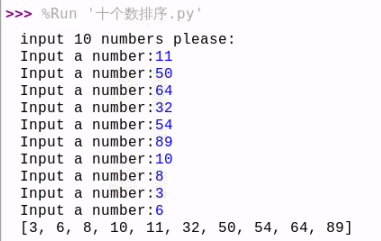
【程序 4】对 10 个数进行排序。
print 'input 10 numbers please:'
 l = []
 for i in range(10):
 l.append(int(raw_input('Input a number:')))
#可以直接使用 sort 函数:l.sort()
#也可以自己写排序代码(选择排序)
for i in range(9):
 for j in range(i+1,10):
 if l[j]<l[i]:
 temp = l[j]
 l[j] = l[i]
 l[i] = temp
print l
更改后代码:
print('input 10 numbers please:')
l = []
for i in range(10):
    l.append(int(input('Input a number:')))
#可以直接使用 sort 函数:l.sort()
#也可以自己写排序代码(选择排序)
for i in range(9):
    for j in range(i+1,10):
        if l[j]<l[i]:
            temp = l[j]
            l[j] = l[i]
            l[i] = temp
print(l)
运行结果:
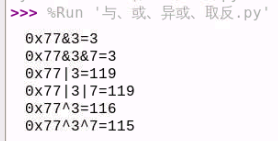
【程序 5】 1)学习使用按位与 &
程序分析:0&0=0; 0&1=0; 1&0=0; 1&1=1
2)学习使用按位或 | 。
程序分析:0|0=0; 0|1=1; 1|0=1; 1|1=1
3)学习使用按位异或 ^ 。
程序分析:0^0=0; 0^1=1; 1^0=1; 1^1=0
4)学习使用按位取反~。
程序分析:~0=1; ~1=0
a = 077 #8 进制
b = a&3
print '077&3=%d'%b
b &= 7
print '077&3&7=%d'%b
a = 077
b = a | 3
print '077|3=%d' % b
b |= 7
print '077|3|7=%d' % b
a = 077
b = a ^ 3
print '077^3=%d' % b
b ^= 7
print '077^3^7=%d' % b
运行结果:
【程序 6】 使用 matplotlib 绘图
安装与配置 matplotlib 环境,调试并通过以下程序。
sudo apt-get install python3-matplotlib
import matplotlib.pyplot as plt
import numpy as np
values = [0.09,-0.05,0.20,-0.02,0.08,0.09,0.03,0.027]
x = np.linspace(0,2*np.pi,9)[:-1]
c = np.random.random(size=(8,3))
fig = plt.figure()
plt.axes(polar=True)
#获取当前的 axes
print(plt.gca())
#绘图
plt.bar(x,values,width=0.5,color=c,align='center')
plt.scatter(x,values,marker='o',c='black')
#添加文本
plt.figtext(0.03,0.7,s='陆地面积增长指数',fontproperties='KaiTi',fontsize=22,rotation='vertical',verticalalignment='center',horizontalalignment='center')
plt.ylim(-0.05, 0.25)
labels = np.array(['省 1','省 2','省 3','省 4','省 5','省 6','省7','研究区'])
dataLength = 8
angles = np.linspace(0, 2*np.pi, dataLength, endpoint=False)
plt.thetagrids(angles * 180/np.pi,labels,fontproperties='KaiTi',fontsize=18)
#添加注释
# plt.annotate(s='省',xy=(0,0.09),xytext=(0,0.28),fontproperties='KaiTi',fontsize=18)
# plt.annotate(s='省',xy=(0,-0.05),xytext=(np.pi/4,0.28),fontproperties='KaiTi',fontsize=18)
# plt.annotate(s='省',xy=(0,0.20),xytext=(np.pi/2,0.28),fontproperties='KaiTi',fontsize=18)
# plt.annotate(s='省',xy=(0,-0.02),xytext=(3*np.pi/4,0.33),fontproperties='KaiTi',fontsize=18)
# plt.annotate(s='省',xy=(0,0.08),xytext=(np.pi,0.38),fontproperties='KaiTi',fontsize=18)
# plt.annotate(s='省',xy=(0,0.09),xytext=(np.pi*5/4,0.35),fontproperties='KaiTi',fontsize=18)
# plt.annotate(s='前江省',xy=(0,0.03),xytext=(np.pi*3/2,0.30),fontproperties='KaiTi',fontsize=18)
# plt.annotate(s='研究区',xy=(0,0.027),xytext=(np.pi*7/4,0.28),fontproperties='KaiTi',fontsize=18)
#设置网格线样式
plt.grid(c='gray',linestyle='--',)
# y1 = [-0.05,0.0,0.05,0.10,0.15,0.20,0.25]
# lai=fig.add_axes([0.12,0.01,0.8,0.98])
# lai.patch.set_alpha(0.25)
# lai.set_ylim(-0.05, 0.25)
#显示
plt.show()
更改后代码:
import matplotlib.pyplot as plt
import numpy as np
values = [0.09,-0.05,0.20,-0.02,0.08,0.09,0.03,0.027]
x = np.linspace(0,2*np.pi,9)[:-1]
c = np.random.random(size=(8,3))
fig = plt.figure()
plt.axes(polar=True)
#获取当前的 axes
print(plt.gca())
#绘图
plt.bar(x,values,width=0.5,color=c,align='center')
plt.scatter(x,values,marker='o',c='black')
#添加文本
plt.figtext(0.03,0.7,s='陆地面积增长指数',fontproperties='KaiTi',fontsize=22,rotation='vertical',verticalalignment='center',horizontalalignment='center')
plt.ylim(-0.05, 0.25)
labels = np.array(['省 1','省 2','省 3','省 4','省 5','省 6','省7','研究区'])
dataLength = 8
angles = np.linspace(0, 2*np.pi, dataLength, endpoint=False)
plt.thetagrids(angles * 180/np.pi,labels,fontproperties='KaiTi',fontsize=18)
#添加注释
# plt.annotate(s='省',xy=(0,0.09),xytext=(0,0.28),fontproperties='KaiTi',fontsize=18)
# plt.annotate(s='省',xy=(0,-0.05),xytext=(np.pi/4,0.28),fontproperties='KaiTi',fontsize=18)
# plt.annotate(s='省',xy=(0,0.20),xytext=(np.pi/2,0.28),fontproperties='KaiTi',fontsize=18)
# plt.annotate(s='省',xy=(0,-0.02),xytext=(3*np.pi/4,0.33),fontproperties='KaiTi',fontsize=18)
# plt.annotate(s='省',xy=(0,0.08),xytext=(np.pi,0.38),fontproperties='KaiTi',fontsize=18)
# plt.annotate(s='省',xy=(0,0.09),xytext=(np.pi*5/4,0.35),fontproperties='KaiTi',fontsize=18)
# plt.annotate(s='前江省',xy=(0,0.03),xytext=(np.pi*3/2,0.30),fontproperties='KaiTi',fontsize=18)
# plt.annotate(s='研究区',xy=(0,0.027),xytext=(np.pi*7/4,0.28),fontproperties='KaiTi',fontsize=18)
#设置网格线样式
plt.grid(c='gray',linestyle='--',)
# y1 = [-0.05,0.0,0.05,0.10,0.15,0.20,0.25]
# lai=fig.add_axes([0.12,0.01,0.8,0.98])
# lai.patch.set_alpha(0.25)
# lai.set_ylim(-0.05, 0.25)
#显示
plt.show()
运行结果:
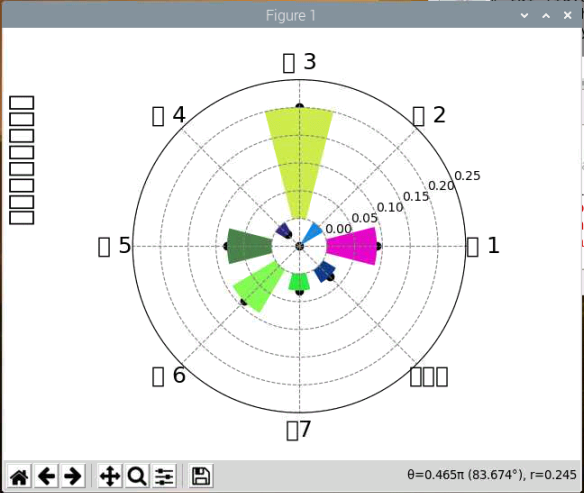
可以看到图中字体无法正常显示,也有报错:
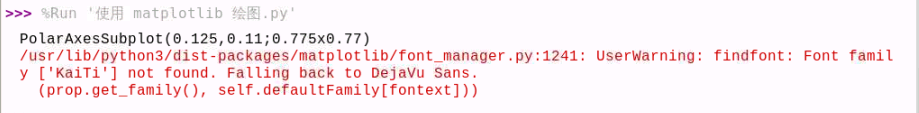
到最后也没能解决这个问题。。。网上很多办法也不管用,希望有大佬能帮我解答一下。


