Python之gmplot:gmplot库的简介、安装、使用方法之详细攻略
目录
gmplot库的简介
gmplot库的安装
gmplot库的使用方法
1、基础用法
gmplot库的简介
一个类似matplotlib的接口,可以在谷歌地图上渲染你想要的所有数据。有几种绘图方法可以轻松地创建探索性地图视图。
文档:https://github.com/gmplot/gmplot/wiki
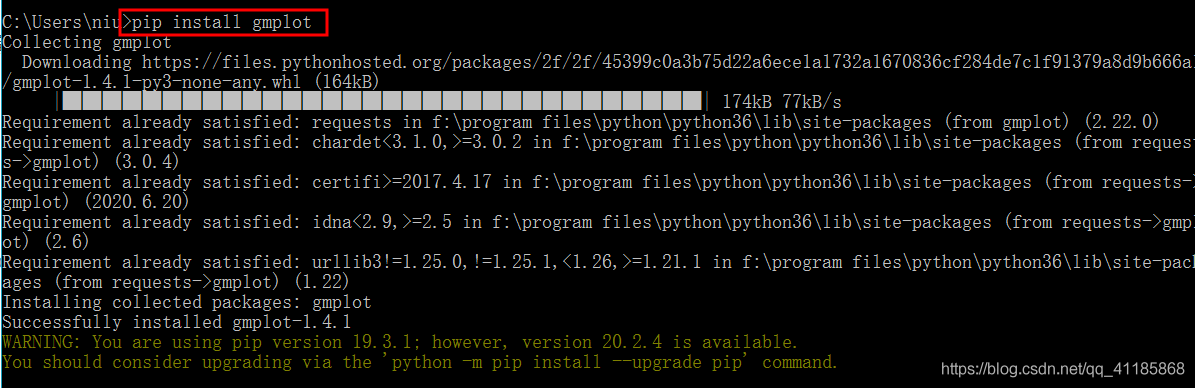
gmplot库的安装
pip install gmplot
gmplot库的使用方法
1、基础用法
import gmplot

# Create the map plotter:
apikey = '' # (your API key here)
gmap = gmplot.GoogleMapPlotter(37.766956, -122.448481, 14, apikey=apikey)

# Outline the Golden Gate Park:
golden_gate_park = zip(*[
    (37.771269, -122.511015),
    (37.773495, -122.464830),
    (37.774797, -122.454538),
    (37.771988, -122.454018),
    (37.773646, -122.440979),
    (37.772742, -122.440797),
    (37.771096, -122.453889),
    (37.768669, -122.453518),
    (37.766227, -122.460213),
    (37.764028, -122.510347)
])
gmap.polygon(*golden_gate_park, color='cornflowerblue', edge_width=10)

# Highlight some attractions:
attractions_lats, attractions_lngs = zip(*[
    (37.769901, -122.498331),
    (37.768645, -122.475328),
    (37.771478, -122.468677),
    (37.769867, -122.466102),
    (37.767187, -122.467496),
    (37.770104, -122.470436)
])
gmap.scatter(attractions_lats, attractions_lngs, color='#3B0B39', size=40, marker=False)

# Mark a hidden gem:
gmap.marker(37.770776, -122.461689, color='cornflowerblue')

# Draw the map:
gmap.draw('map.html')


