stata绘图专题【计量经济系列(二)】
文章目录
- 1. 命令结构
- 2. 散点图 scatter
- 3. 折线图 line
- 4. 面积图 area
- 5. 直方图 histogram
- 6. 核密度估计图 kdensity
- 7. 条形图 bar
- 8. 箱线图
- 9. 饼形图
- 10. 矩阵图 matrix
- 11. 点阵图 dot
- 12. 时间序列数据折线图 tsline
- 13. 水平线与垂直线:yline()与 xline()
- 14. 拟合回归线
- 15. 保存图像 graph save

ʚʕ̯•͡˔•̯᷅ʔɞʚʕ̯•͡˔•̯᷅ʔɞʚʕ̯•͡˔•̯᷅ʔɞʚʕ̯•͡˔•̯᷅ʔɞʚʕ̯•͡˔•̯᷅ʔɞʚʕ̯•͡˔•̯᷅ʔɞʚʕ̯•͡˔•̯᷅ʔɞʚʕ̯•͡˔•̯᷅ʔɞʚʕ̯•͡˔•̯᷅ʔɞʚʕ̯•͡˔•̯᷅ʔɞ

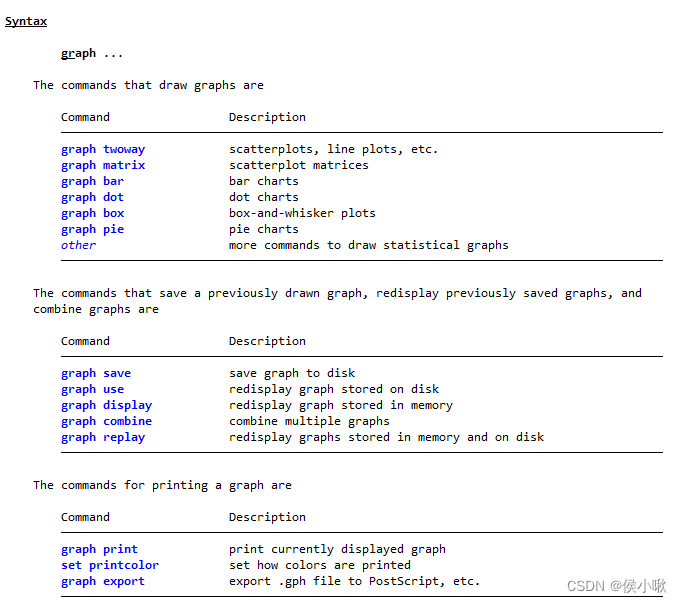
1. 命令结构
graph-command (plot-command, plot-options) (plot-command , plot-options) , graph-options
或者
graph-command plot-command,plot-options || plot-command , plot-options || , graph-options
其中,graph-command用于定义图的类型, 常用的是twoway命令,也可以写成graph twoway
plot-command用于定义线的类型。常用的有,点(scatter)、线(line)、面(area),直方图(histogram)、
条形图(bar)、饼图(pie)、函数曲线(function)以及矩阵图(matrix)等。
2. 散点图 scatter
sysuse auto , clear
twoway (scatter mpg weight)

上述代码还可以简写成以下各种形式:
sysuse auto, clear
graph twoway scatter mpg weight
twoway scatter mpg weight
scatter mpg weight
gr tw sc mpg weight
tw sc mpg weight
sc mpg weight
上述代码即可满足一般需求,如需更多细节,则参考下边代码。
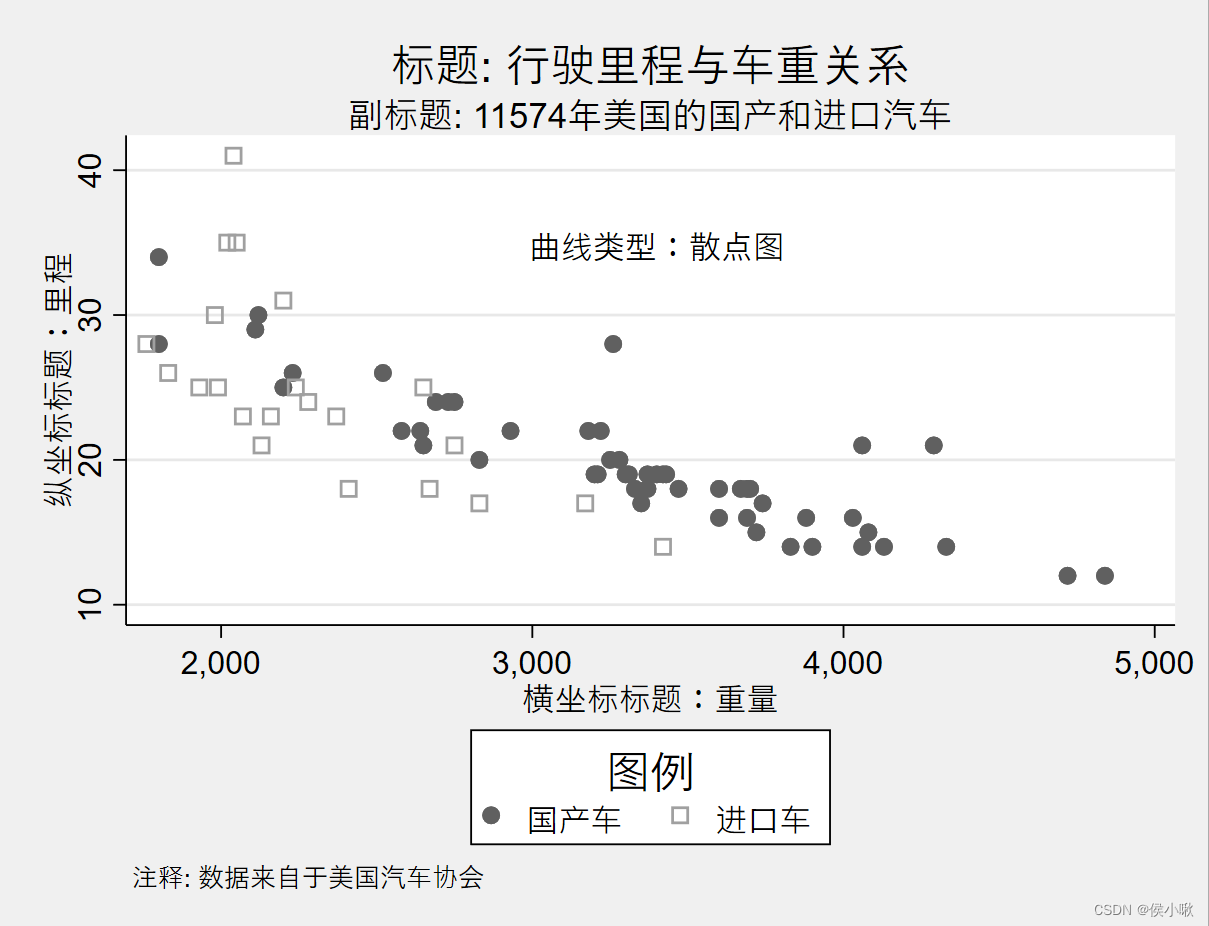
sysuse auto,clear
graph twoway (scatter mpg weight if foreign==0) ///
(scatter mpg weight if foreign==1 ,msymbol(Sh)), ///
 title(标题: 行驶里程与车重关系) ///
 subtitle(副标题: 11574年美国的国产和进口汽车) ///
 ytitle(纵坐标标题:里程) ///
 xtitle(横坐标标题:重量) ///
 note(注释: 数据来自于美国汽车协会)  ///
 text(35 3400 "曲线类型:散点图")  ///
 legend(title(图例)  ///
 label(1 国产车)  ///
 label(2 进口车)) ///
 scheme(s2manual)
同一个图中如果有多条曲线可以用括号分开,也可以用“||”分开。
其中scheme是图像的风格,这里使用的是s2manual风格,可以使用的scheme还有:

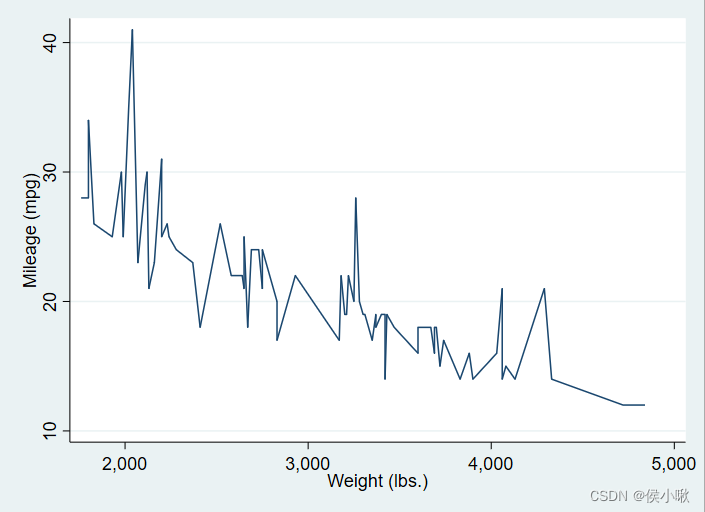
3. 折线图 line
sysuse auto , clear
sort weight
twoway line mpg weight
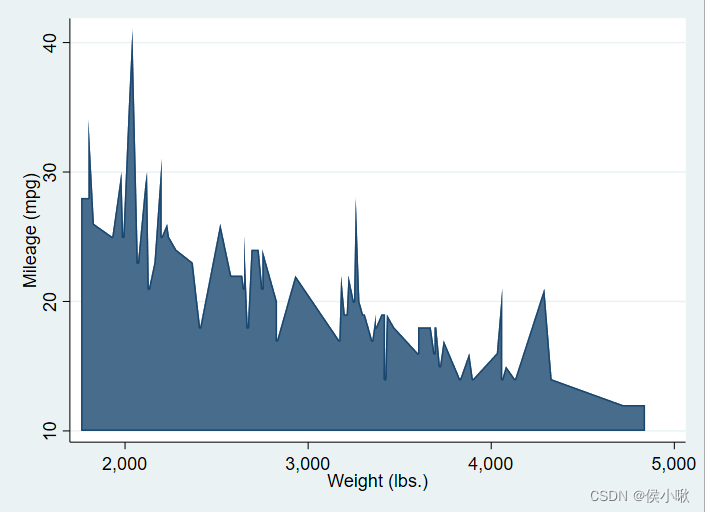
4. 面积图 area
sysuse auto , clear
sort weight
twoway area mpg weight
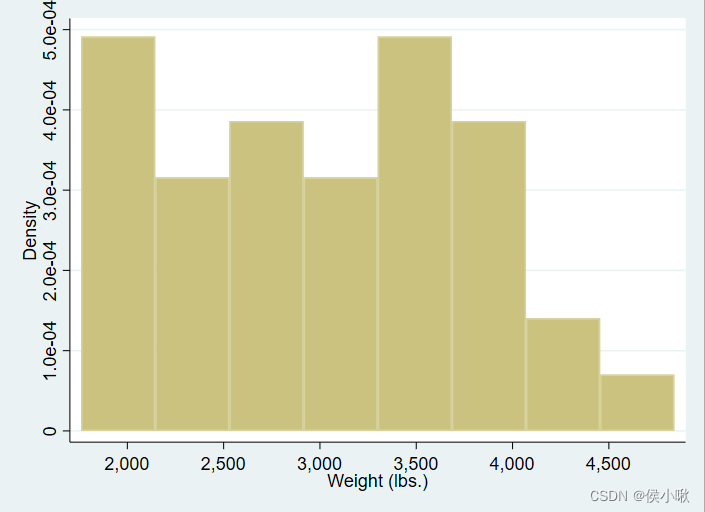
5. 直方图 histogram
sysuse auto , clear
twoway histogram weight
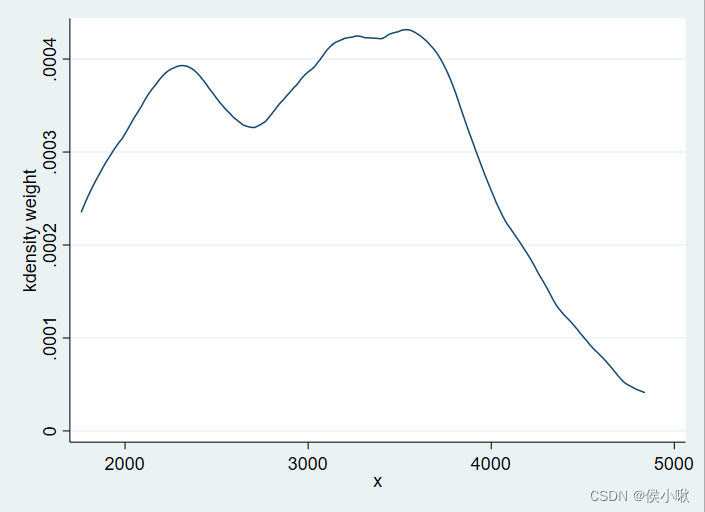
6. 核密度估计图 kdensity
sysuse auto , clear
twoway kdensity weight
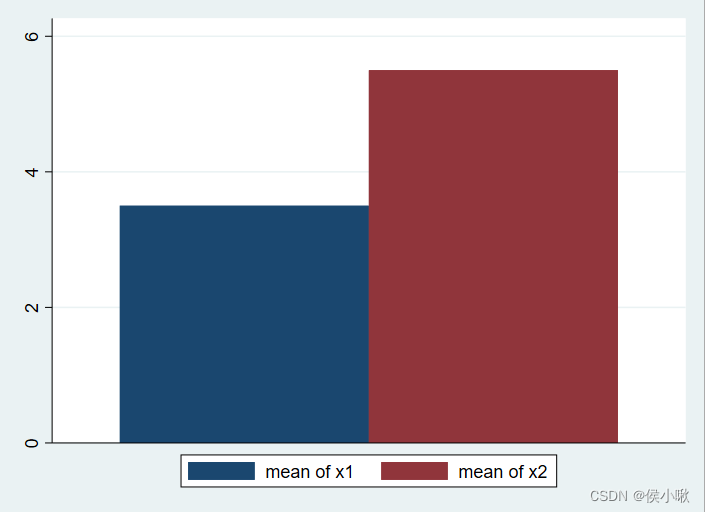
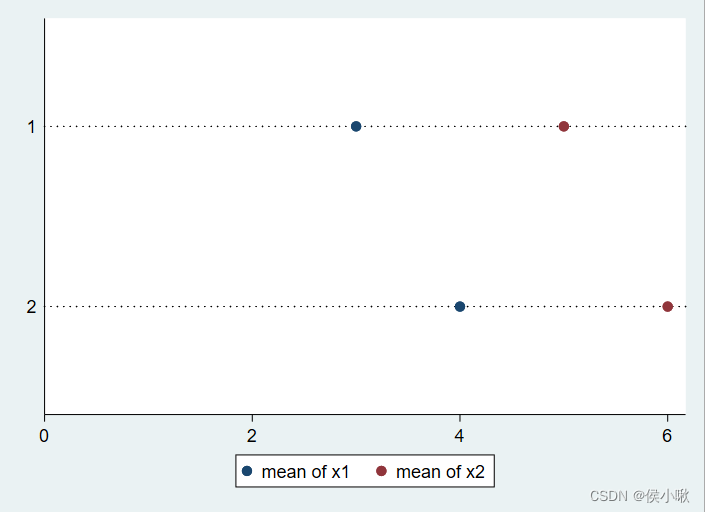
7. 条形图 bar
graph bar
使用graph bar,绘制出来的纵轴表示是均值,这个与我们对条形图的预期不符,所以一般用不到。
clear
input x1-x3
1 3 1
2 4 2
3 5 1
4 6 2
5 7 1
6 8 2
end
graph bar x1 x2
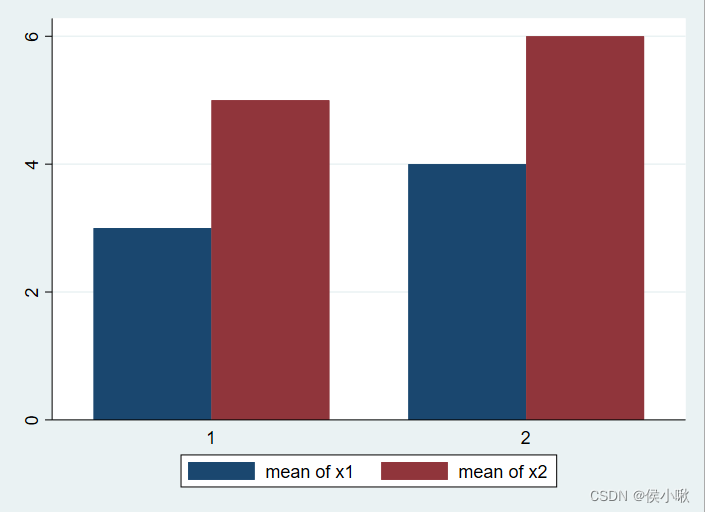
使用over可以指定分类的变量
clear
input x1-x3
1 3 1
2 4 2
3 5 1
4 6 2
5 7 1
6 8 2
end
graph bar x1 x2,over(x3)
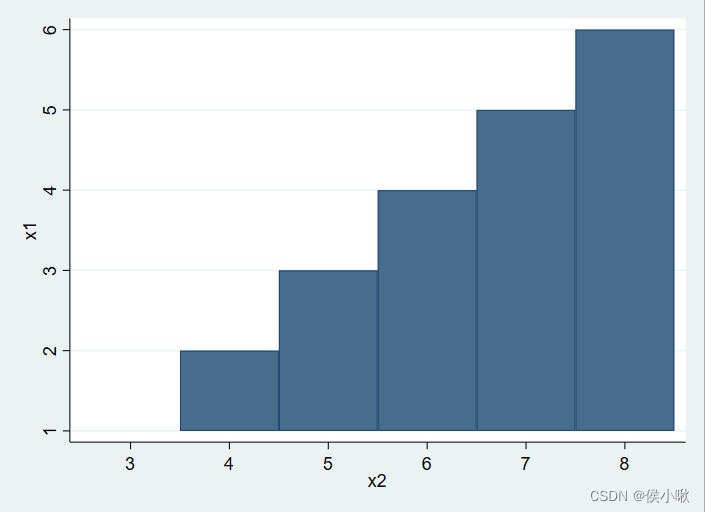
twoway bar
clear
input x1-x3
1 3 1
2 4 2
3 5 1
4 6 2
5 7 1
6 8 2
end
twoway bar x1 x2
水平条形图 hbar
使用 hbar 可以绘制出水平方向上的条形图,语法规则同上。
__
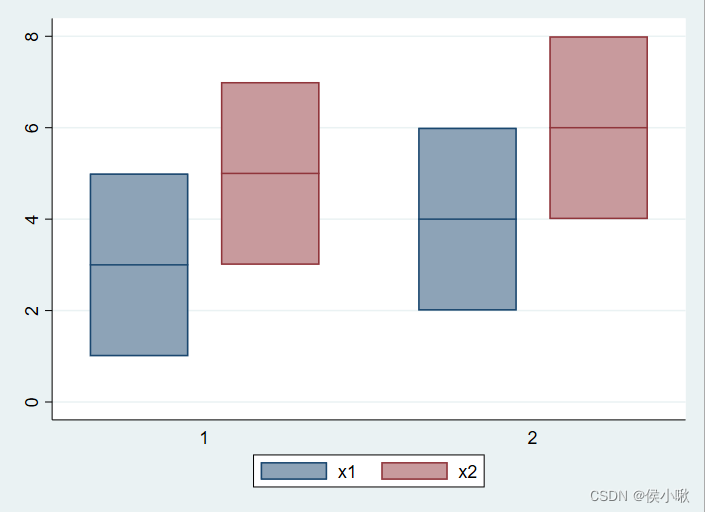
8. 箱线图
clear
input x1-x3
1 3 1
2 4 2
3 5 1
4 6 2
5 7 1
6 8 2
end
graph box x1 x2

clear
input x1-x3
1 3 1
2 4 2
3 5 1
4 6 2
5 7 1
6 8 2
end
graph box x1 x2,over(x3)
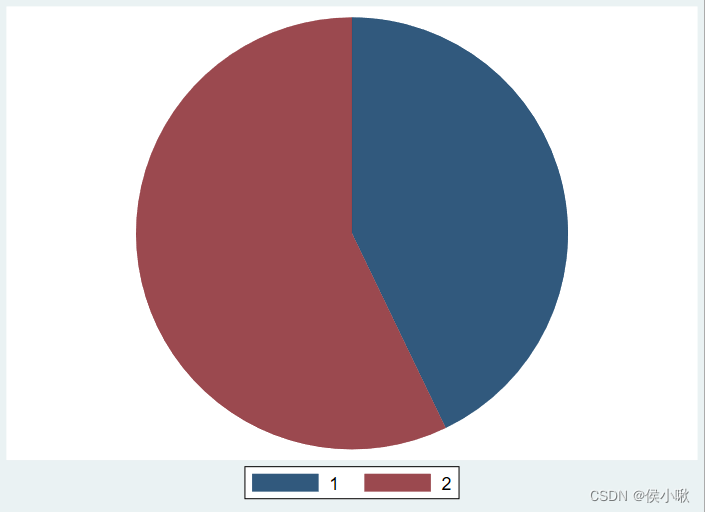
9. 饼形图
clear
input x1-x3
1 3 1
2 4 2
3 5 1
4 6 2
5 7 1
6 8 2
end
graph pie x1, over(x3)
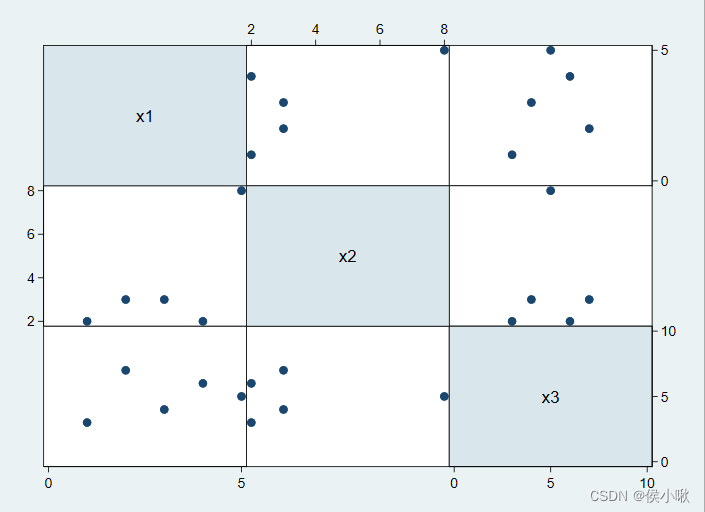
10. 矩阵图 matrix
clear
input x1-x3
1 2 3
2 3 7
4 2 6
3 3 4
5 8 5
end
graph matrix x1 x2 x3
11. 点阵图 dot
clear
input x1-x3
1 3 1
2 4 2
3 5 1
4 6 2
5 7 1
6 8 2
end
graph dot x1 x2,over(x3)
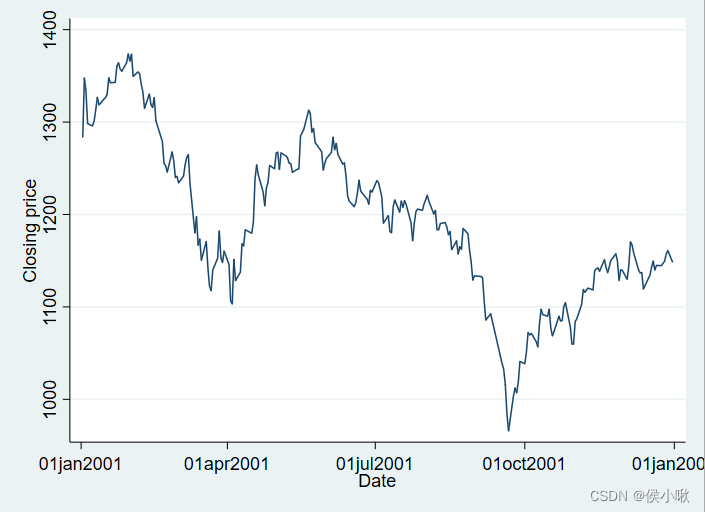
12. 时间序列数据折线图 tsline
以date数据作为时间序列数据x轴。
sysuse sp500, clear
tsset date
 twoway tsline close, sort
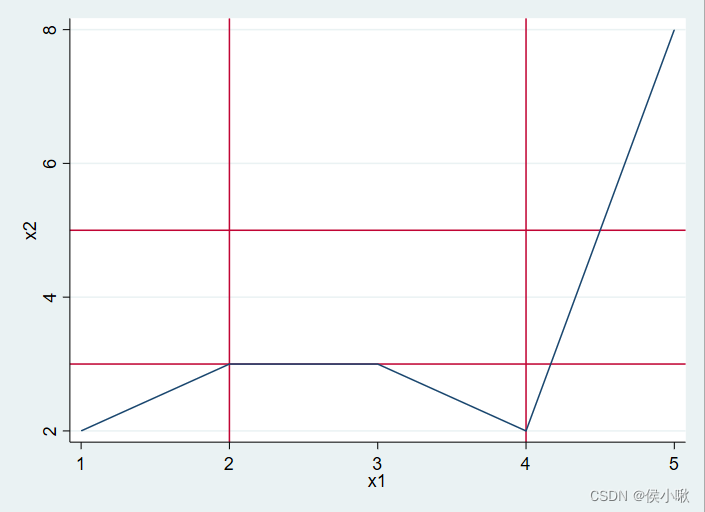
13. 水平线与垂直线:yline()与 xline()
clear
input x1-x3
1 3 1
2 4 2
3 5 1
4 6 2
5 7 1
6 8 2
end
sort x1
twoway line x2 x1,xline(2 4) yline(5 3)
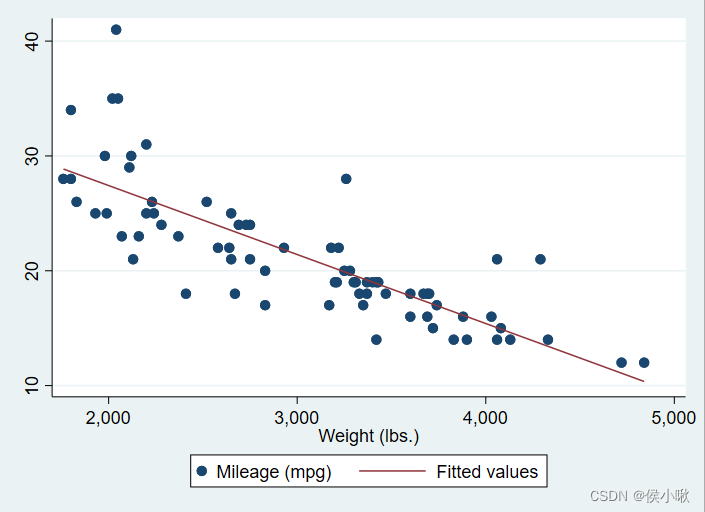
14. 拟合回归线
回归直线lfit
同时绘制拟合的直线和散点图。
sysuse auto , clear
twoway (scatter mpg weight)(lfit mpg weight)
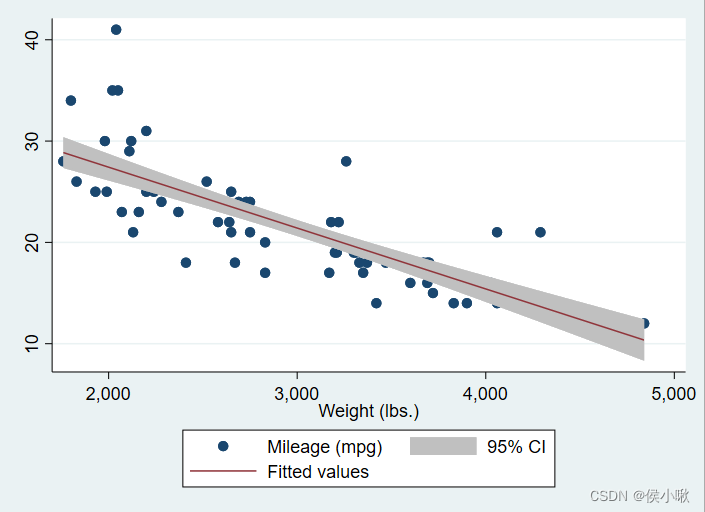
回归直线 并绘制置信区间 lfitci
默认绘制95%的置信区间。
sysuse auto , clear
twoway (scatter mpg weight)(lfitci mpg weight)
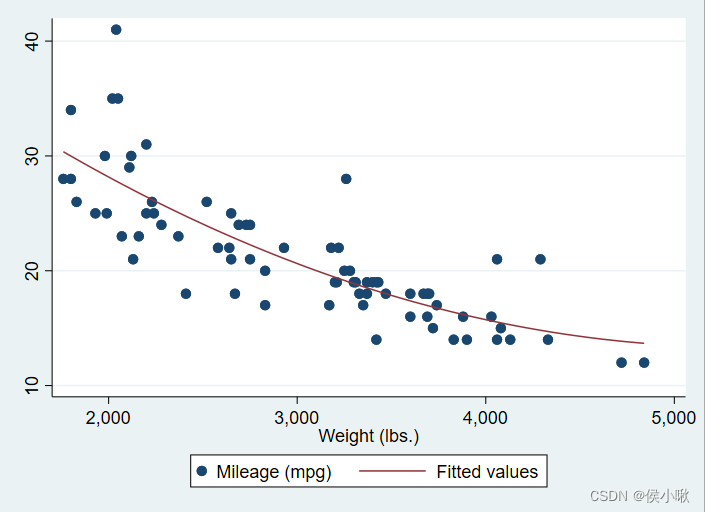
二次回归线 qfit
(根据xvar和xvar^2上的yvar线性回归计算yvar预测值,并绘制结果曲线)
sysuse auto , clear
twoway (scatter mpg weight)(qfit mpg weight)
15. 保存图像 graph save
sysuse auto , clear
graph save "picturename.gph"
本次分享就到这里,小啾感谢您的关注与支持!
🌹꧔ꦿ🌹꧔ꦿ🌹꧔ꦿ🌹꧔ꦿ🌹꧔ꦿ🌹꧔ꦿ🌹꧔ꦿ🌹꧔ꦿ🌹꧔ꦿ🌹꧔ꦿ🌹꧔ꦿ🌹꧔ꦿ🌹꧔ꦿ🌹꧔ꦿ🌹꧔ꦿ🌹꧔ꦿ🌹꧔ꦿ🌹꧔ꦿ🌹꧔ꦿ🌹꧔ꦿ🌹꧔ꦿ🌹꧔ꦿ🌹꧔ꦿ🌹꧔ꦿ🌹꧔ꦿ🌹꧔ꦿ🌹꧔ꦿ🌹꧔ꦿ


