代码:
option = {
tooltip: {
trigger: 'axis',
borderWidth: 0,
padding: 10,
textStyle: {
color: '#fff'
},
backgroundColor: 'rgba(0,0,0,0.65)',
confine: true
},
grid: {
left: '5%',
right: '5%',
top: 0,
bottom: '28%'
},
xAxis: {
type: 'category',
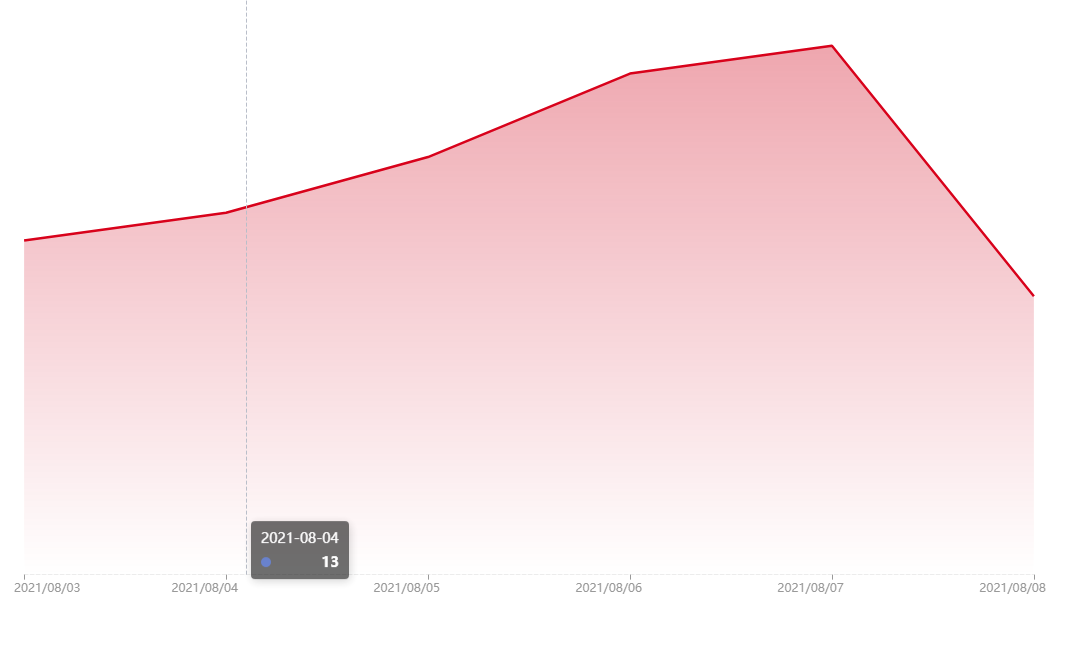
data: ['2021-08-03','2021-08-04','2021-08-05','2021-08-06','2021-08-07','2021-08-08'],
axisTick: {
lineStyle: {
color: '#999'
}
},
axisLabel: {
color: '#999',
showMinLabel: true,
showMaxLabel: true,
formatter: function(value, index) {
if (value !== '') {
value = value.split('-')[0] + '/' + value.split('-')[1] + '/' + value.split('-')[2]
}
const data = []
data.push(index)
const count = data[data.length - 1]
if (index === 0 && value !== '') {
return ' ' + value
}
if (index === count && value !== '') {
return value + ' '
}
}
},
axisLine: {
lineStyle: {
type: 'dashed',
color: '#ececec'
}
},
boundaryGap: false
},
yAxis: {
type: 'value',
show: false
},
series: [{
data: [12,13,15,18,19,10],
type: 'line',
lineStyle: {
color: '#d0021b'
},
connectNulls: true,
symbol: 'none',
areaStyle: {
color: new echarts.graphic.LinearGradient(0, 0, 0, 1, [{
offset: 0,
color: 'rgba(208,2,27,0.5)'
}, {
offset: 1,
color: 'rgba(208,2,27,0)'
}])
}
}]
};
最终的效果: