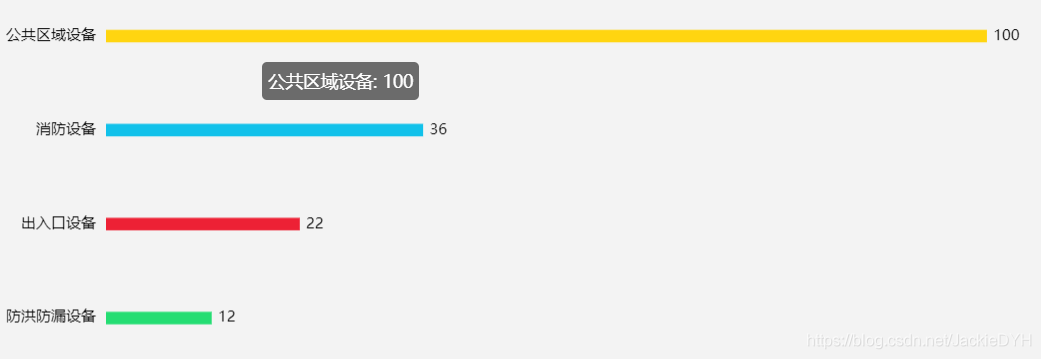
效果图
效果代码
option = {
            textStyle: {
                // fontSize: arr.initHeight,
                color: 'black'//字体颜色
            },
            tooltip: {
                trigger: "axis",
                textStyle: {
                    // fontSize: arr.initHeight,
                    color: 'black',//字体颜色
                },
                        //   formatter: function (params) {
                        //      return params[0].name + ': ' + params[0].value+"%";
                        //   },
            },
            yAxis: {
                data: ['六分公司', '五分公司', '四分公司', '三分公司', "二分公司"],
                axisTick: {       //x轴刻度线
                    show: false
                },
                splitLine: {     //网格线
                    show: false
                },
                axisLine: {    //坐标轴线
                    show: false
                },
            axisLabel:{ //调整文字倾斜角度和颜色
                interval:0,
                rotate:45,
                margin:2,
                textStyle:{
                color:"#222"
                }
            },

            },
            xAxis: {
                show: false,
                max: 100,
                min: 0,
            },
            grid: {
                left: '0%',
                right: '15%',
                bottom: '40%',
                // top:"300%",
                containLabel: true
            },
      tooltip: {
        // 悬停指示
        trigger: "item",
        formatter: "{b}: {c}%"
      },
            series: [{
                name: '收缴率',
                type: 'bar',
                stack: '使用情况',
                data: [100, 88.3, 90.5, 95.6, 98.6],
                barWidth: 10,//柱图宽度
                itemStyle: {
                    barBorderRadius: [50, 50, 50, 50] // 统一设置四个角的圆角大小
                },
                //标签
                label: {
                    normal: {
                        show: true,
                        position: 'right',
                        formatter: '{c}%',//模板变量有 {a}、{b}、{c}、{d},分别表示系列名,数据名,数据值,百分比。{d}数据会根据value值计算百分比
                    },
                },
                itemStyle: {
          barBorderRadius: [50, 0, 0, 50], // 统一设置四个角的圆角大小
                    normal: {
                        //这里是重点
                        color: function (params) {
                            //注意,如果颜色太少的话,后面颜色不会自动循环,最好多定义几个颜色
                            var colorList = ['#00F4FF', '#0092FF', '#0061FE', '#002099', '#000682'];
                            return colorList[params.dataIndex]
                        }
                    }
                },
                markPoint: {
                    symbol: 'pin',//标记类型
                    symbolSize: 10,//图形大小
                    itemStyle: {
                        normal: {
                            borderColor: 'green',
                            borderWidth: 1,            // 标注边线线宽,单位px,默认为1
                            label: {
                                show: true,
                                fontSize: 14
                            }
                        }
                    },
                }
            },
            {
                name: '',
                type: 'bar',
                stack: '使用情况',
                // data: [100, 100, 100, 100, 100],
                itemStyle: {
                    barBorderRadius: [0, 50, 50, 0],// 统一设置四个角的圆角大小
                    normal: {
                        //这里是重点
                        color: function (params) {
                            //注意,如果颜色太少的话,后面颜色不会自动循环,最好多定义几个颜色
                            //var colorList = ['#00F4FF', '#0092FF', '#0061FE', '#002099', '#000682'];
              var colorList = ['rgba(255,0,0,.1)','rgba(255,0,0,.1)','rgba(255,0,0,.1)','rgba(255,0,0,.1)','rgba(255,0,0,.1)'];
                            return colorList[params.dataIndex]
                        }
                    }
                },
            }
            ]
        };
option = {
textStyle: {
// fontSize: arr.initHeight,
color: 'black'//字体颜色
},
tooltip: {
trigger: "axis",
textStyle: {
// fontSize: arr.initHeight,
color: 'black',//字体颜色
},
// formatter: function (params) {
// return params[0].name + ': ' + params[0].value+"%";
// },
},
yAxis: {
data: ['五分公司', '四分公司', '三分公司', '二分公司', "一分公司"],
axisTick: { //x轴刻度线
show: false
},
splitLine: { //网格线
show: false
},
axisLine: { //坐标轴线
show: false
}
},
xAxis: {
show: false,
max: 100,
min: 0,
},
grid: {
left: '0%',
right: '15%',
bottom: '40%',
// top:"300%",
containLabel: true
},
tooltip: {
// 悬停指示
trigger: "item",
formatter: "{b}: {c}%"
},
series: [{
name: '收缴率',
type: 'bar',
stack: '使用情况',
data: [100, 88.3, 90.5, 95.6, 98.6],
barWidth: 10,//柱图宽度
itemStyle: {
barBorderRadius: [50, 50, 50, 50] // 统一设置四个角的圆角大小
},
//标签
label: {
normal: {
show: true,
position: 'right',
formatter: '{c}%',//模板变量有 {a}、{b}、{c}、{d},分别表示系列名,数据名,数据值,百分比。{d}数据会根据value值计算百分比
},
},
itemStyle: {
barBorderRadius: [50, 0, 0, 50], // 统一设置四个角的圆角大小
normal: {
//这里是重点
color: function (params) {
//注意,如果颜色太少的话,后面颜色不会自动循环,最好多定义几个颜色
var colorList = ['#00F4FF', '#0092FF', '#0061FE', '#002099', '#000682'];
return colorList[params.dataIndex]
}
}
},
markPoint: {
symbol: 'pin',//标记类型
symbolSize: 10,//图形大小
itemStyle: {
normal: {
borderColor: 'green',
borderWidth: 1, // 标注边线线宽,单位px,默认为1
label: {
show: true,
fontSize: 14
}
}
},
}
},
{
name: '',
type: 'bar',
stack: '使用情况',
// data: [100, 88.3, 90.5, 95.6, 98.6],//设置数值下的阴影
itemStyle: {
barBorderRadius: [0, 50, 50, 0],// 统一设置四个角的圆角大小
normal: {
//这里是重点
color: function (params) {
//注意,如果颜色太少的话,后面颜色不会自动循环,最好多定义几个颜色
//var colorList = ['#00F4FF', '#0092FF', '#0061FE', '#002099', '#000682'];
var colorList = ['rgba(255,0,0,.1)','rgba(255,0,0,.1)','rgba(255,0,0,.1)','rgba(255,0,0,.1)','rgba(255,0,0,.1)'];
return colorList[params.dataIndex]
}
}
},
}
]
};


