监控 Pod
之前的apiserver 实际上就是一种特殊的 Endpoints,现在我们同样来配置一个任务用来专门发现普通类型的 Endpoint,其实就是 Service 关联的 Pod 列表,由于并不是所有的 Endpoints 都会提供 metrics 接口,所以需要我们主动告诉 Prometheus 去发现哪些 Endpoints,当然告诉的方式有很多,不过约定俗成的一种方式是通过 annotations 注解进行通知,如下所示:
- job_name: "endpoints"
  kubernetes_sd_configs:
    - role: endpoints
  relabel_configs:
    # 保留 Service 的注解为 prometheus.io/scrape: true 的 Endpoints
    - source_labels: [__meta_kubernetes_service_annotation_prometheus_io_scrape]
      action: keep
      regex: true
    # 指标接口协议通过 prometheus.io/scheme 这个注解获取 http 或 https
    - source_labels: [__meta_kubernetes_service_annotation_prometheus_io_scheme]
      action: replace
      target_label: __scheme__
      regex: (https?)
    # 指标接口端点路径通过 prometheus.io/path 这个注解获取
    - source_labels: [__meta_kubernetes_service_annotation_prometheus_io_path]
      action: replace
      target_label: __metrics_path__
      regex: (.+)
    # 直接接口地址端口通过 prometheus.io/port 注解获取
    - source_labels:
        [__address__, __meta_kubernetes_service_annotation_prometheus_io_port]
      action: replace
      target_label: __address__
      regex: ([^:]+)(?::\d+)?;(\d+) # RE2 正则规则,+是一次或多次,?是0次或1次,其中?:表示非匹配组(意思就是不获取匹配结果)
      replacement: $1:$2
    # 映射 Service 的 Label 标签
    - action: labelmap
      regex: __meta_kubernetes_service_label_(.+)
    # 将 namespace 映射成标签
    - source_labels: [__meta_kubernetes_namespace]
      action: replace
      target_label: kubernetes_namespace
    # 将 Service 名称映射成标签
    - source_labels: [__meta_kubernetes_service_name]
      action: replace
      target_label: kubernetes_name
    # 将 Pod 名称映射成标签
    - source_labels: [__meta_kubernetes_pod_name]
      action: replace
      target_label: kubernetes_pod_name
有了这个注解,其实就是告诉Prometheus,现在的服务提供metrics接口。通过接口必须告诉其提供的端口和地址是什么,以及协议是什么,这些都通过annotation来提供。
    # 保留 Service 的注解为 prometheus.io/scrape: true 的 Endpoints
    - source_labels: [__meta_kubernetes_service_annotation_prometheus_io_scrape]
      action: keep
      regex: true
注意我们这里在 relabel_configs 区域做了大量的配置,特别是第一个保留__meta_kubernetes_service_annotation_prometheus_io_scrape 为 true 的才保留下来,这就是说要想自动发现集群中的 Endpoint,就需要我们在 Service 的 annotations 区域添加 prometheus.io/scrape=true 的注解,我们也可以借助 Relabeler - The playground for Prometheus relabeling rules 这个工具来帮助我们配置 Relabel。现在我们先将上面的配置更新,查看下效果:
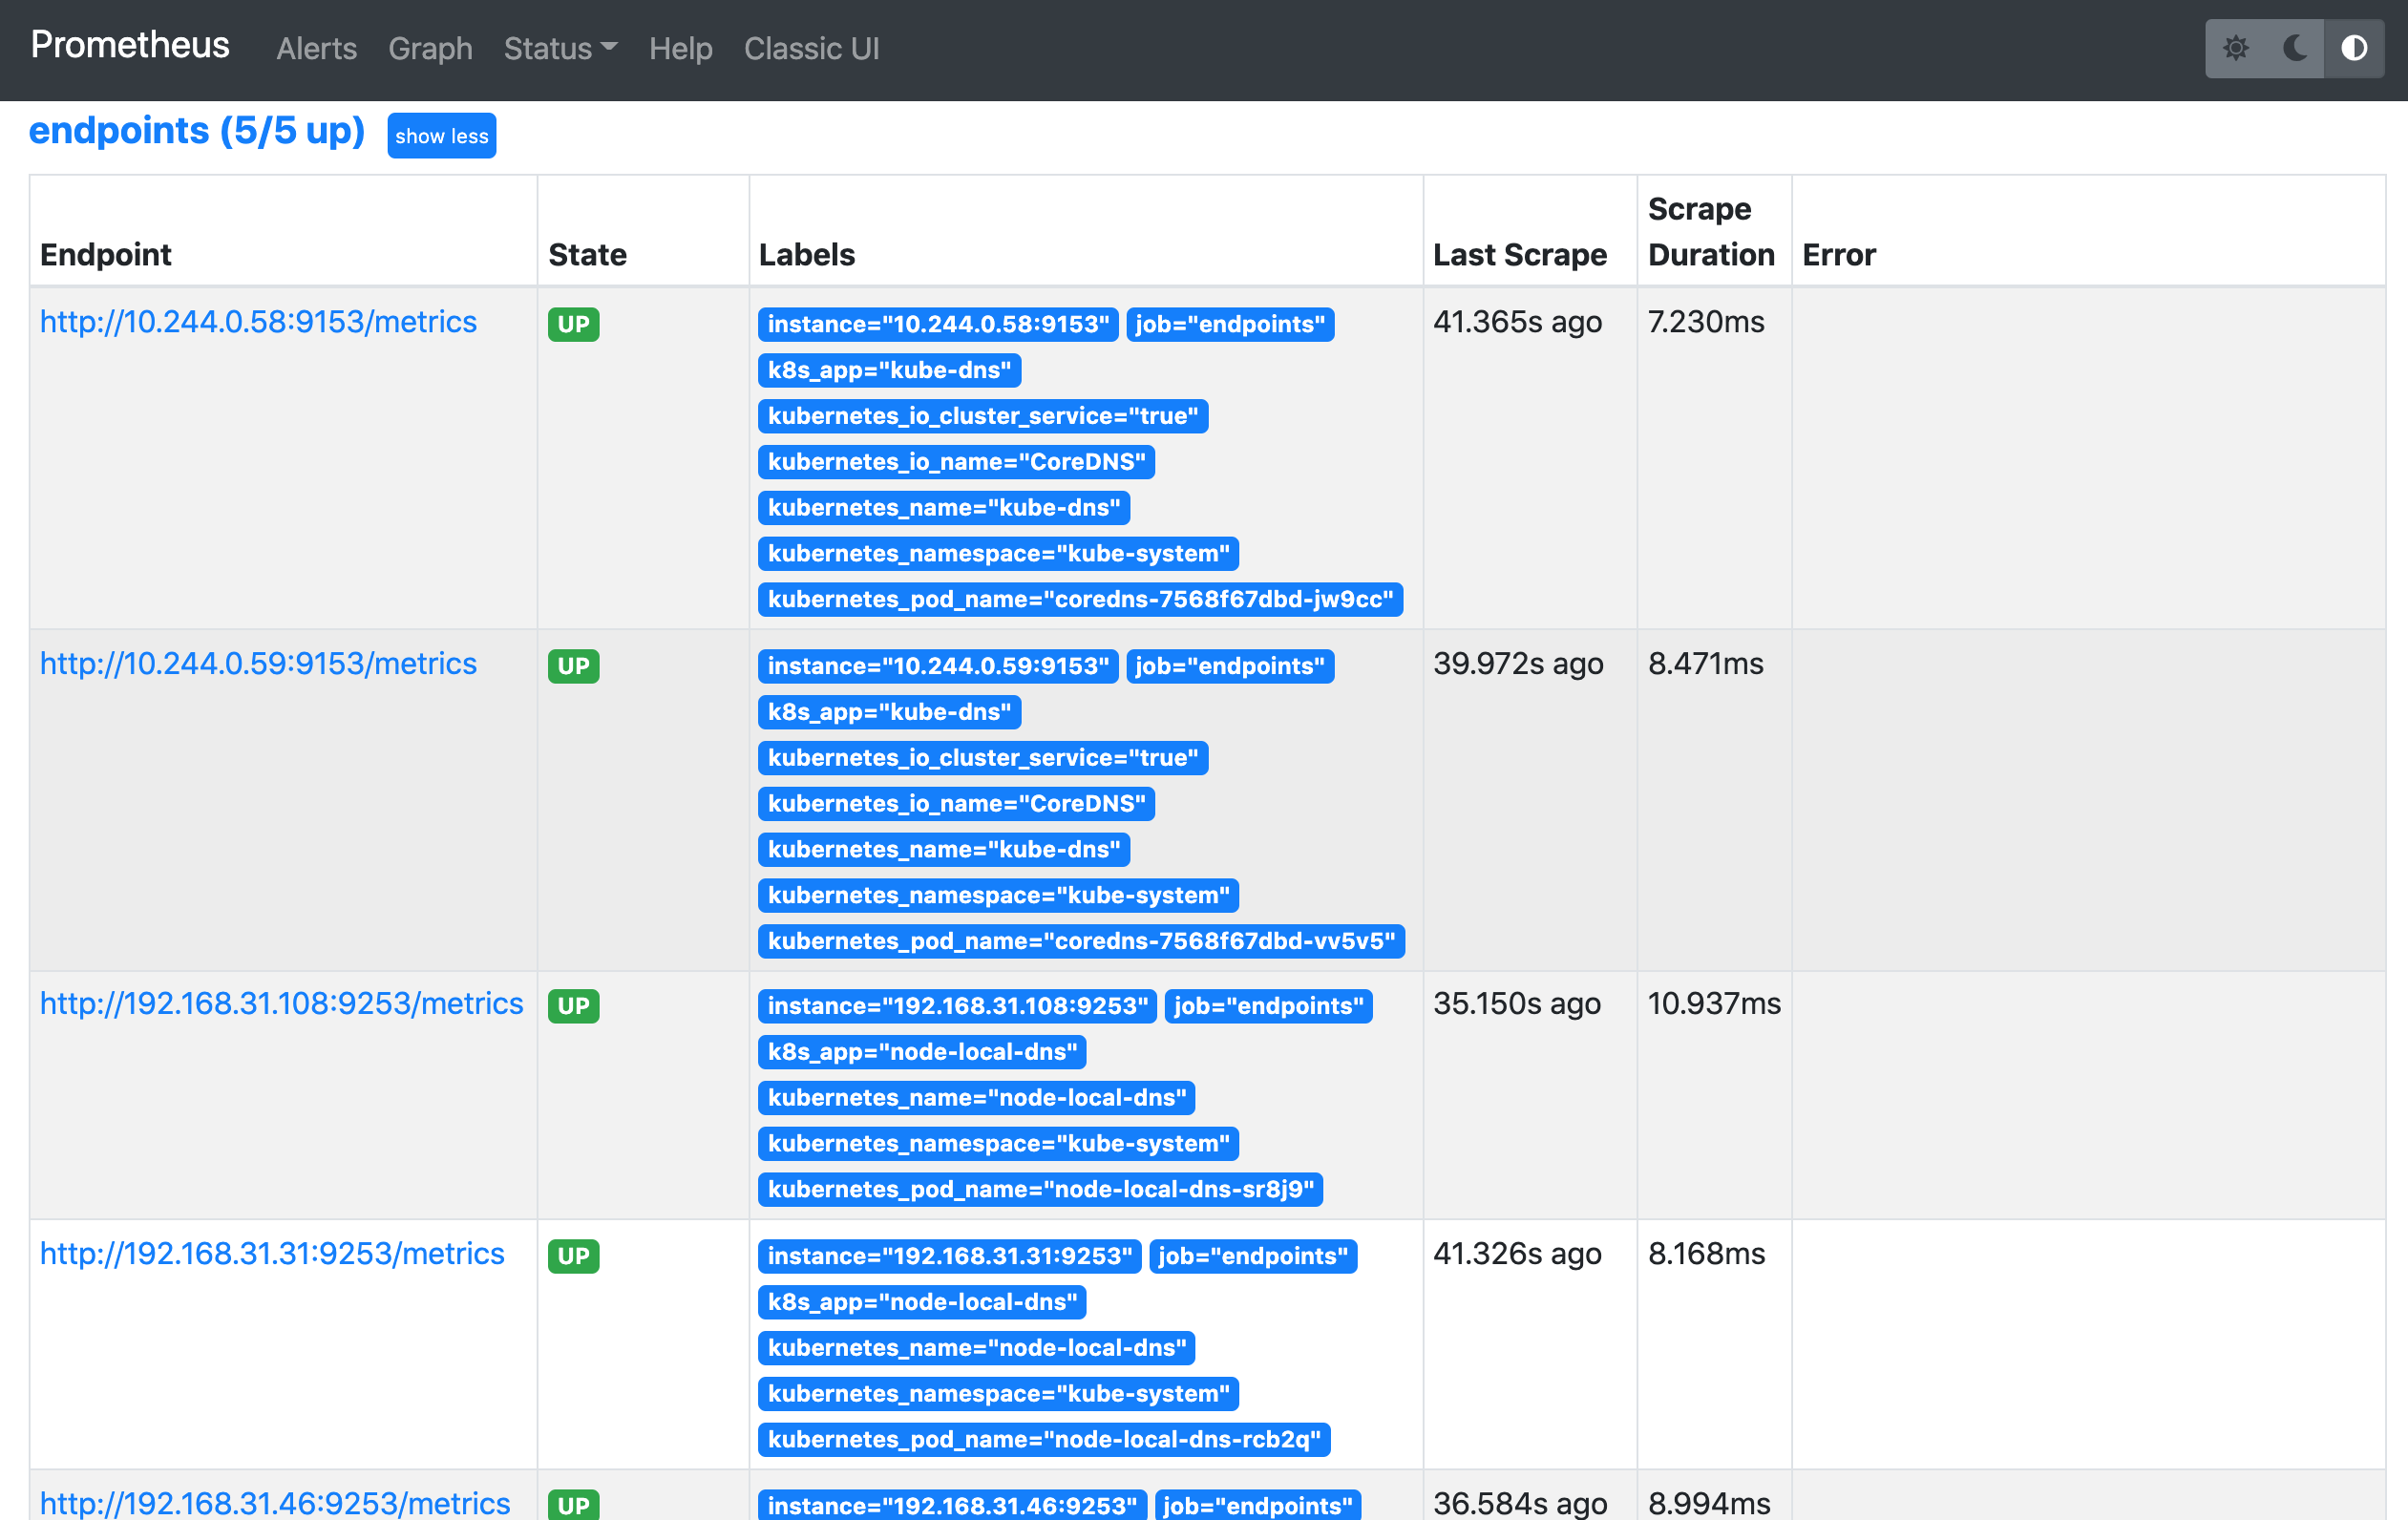
我们可以看到 endpoints 这一个任务下面只发现了 5 个任务,这是因为我们在 relabel_configs 中过滤了 annotations 有 prometheus.io/scrape=true 的 Service,而现在我们系统中只有两个这样的服务符合要求,比如 kube-dns 这个 Service 下面有两个实例,所以出现了两个实例:
☸ ➜ kubectl get svc kube-dns -n kube-system -o yaml
apiVersion: v1
kind: Service
metadata:
  annotations:
    prometheus.io/port: "9153"  # metrics 接口的端口
    prometheus.io/scrape: "true"  # 这个注解可以让prometheus自动发现
  creationTimestamp: "2021-10-25T12:33:14Z"
  labels:
    k8s-app: kube-dns
    kubernetes.io/cluster-service: "true"
    kubernetes.io/name: CoreDNS
  name: kube-dns
  namespace: kube-system
  ......
现在我们在之前创建的 redis 这个 Service 中添加上 prometheus.io/scrape=true 这个注解:
# redis-svc.yaml
kind: Service
apiVersion: v1
metadata:
  name: redis
  namespace: kube-mon
  annotations:
    prometheus.io/scrape: "true" # 让上面的自动发现能获取该服务
    prometheus.io/port: "9121" # 指定metrics接口访问端口
spec:
  selector:
    app: redis
  ports:
    - name: redis
      port: 6379
      targetPort: 6379
    - name: prom
      port: 9121
      targetPort: 9121
由于 redis 服务的 metrics 接口在 9121 这个 redis-exporter 服务上面,所以我们还需要添加一个 prometheus.io/port=9121 这样的 annotations,然后更新这个 Service:
☸ ➜ kubectl apply -f https://p8s.io/docs/k8s/manifests/prometheus/redis-svc.yaml
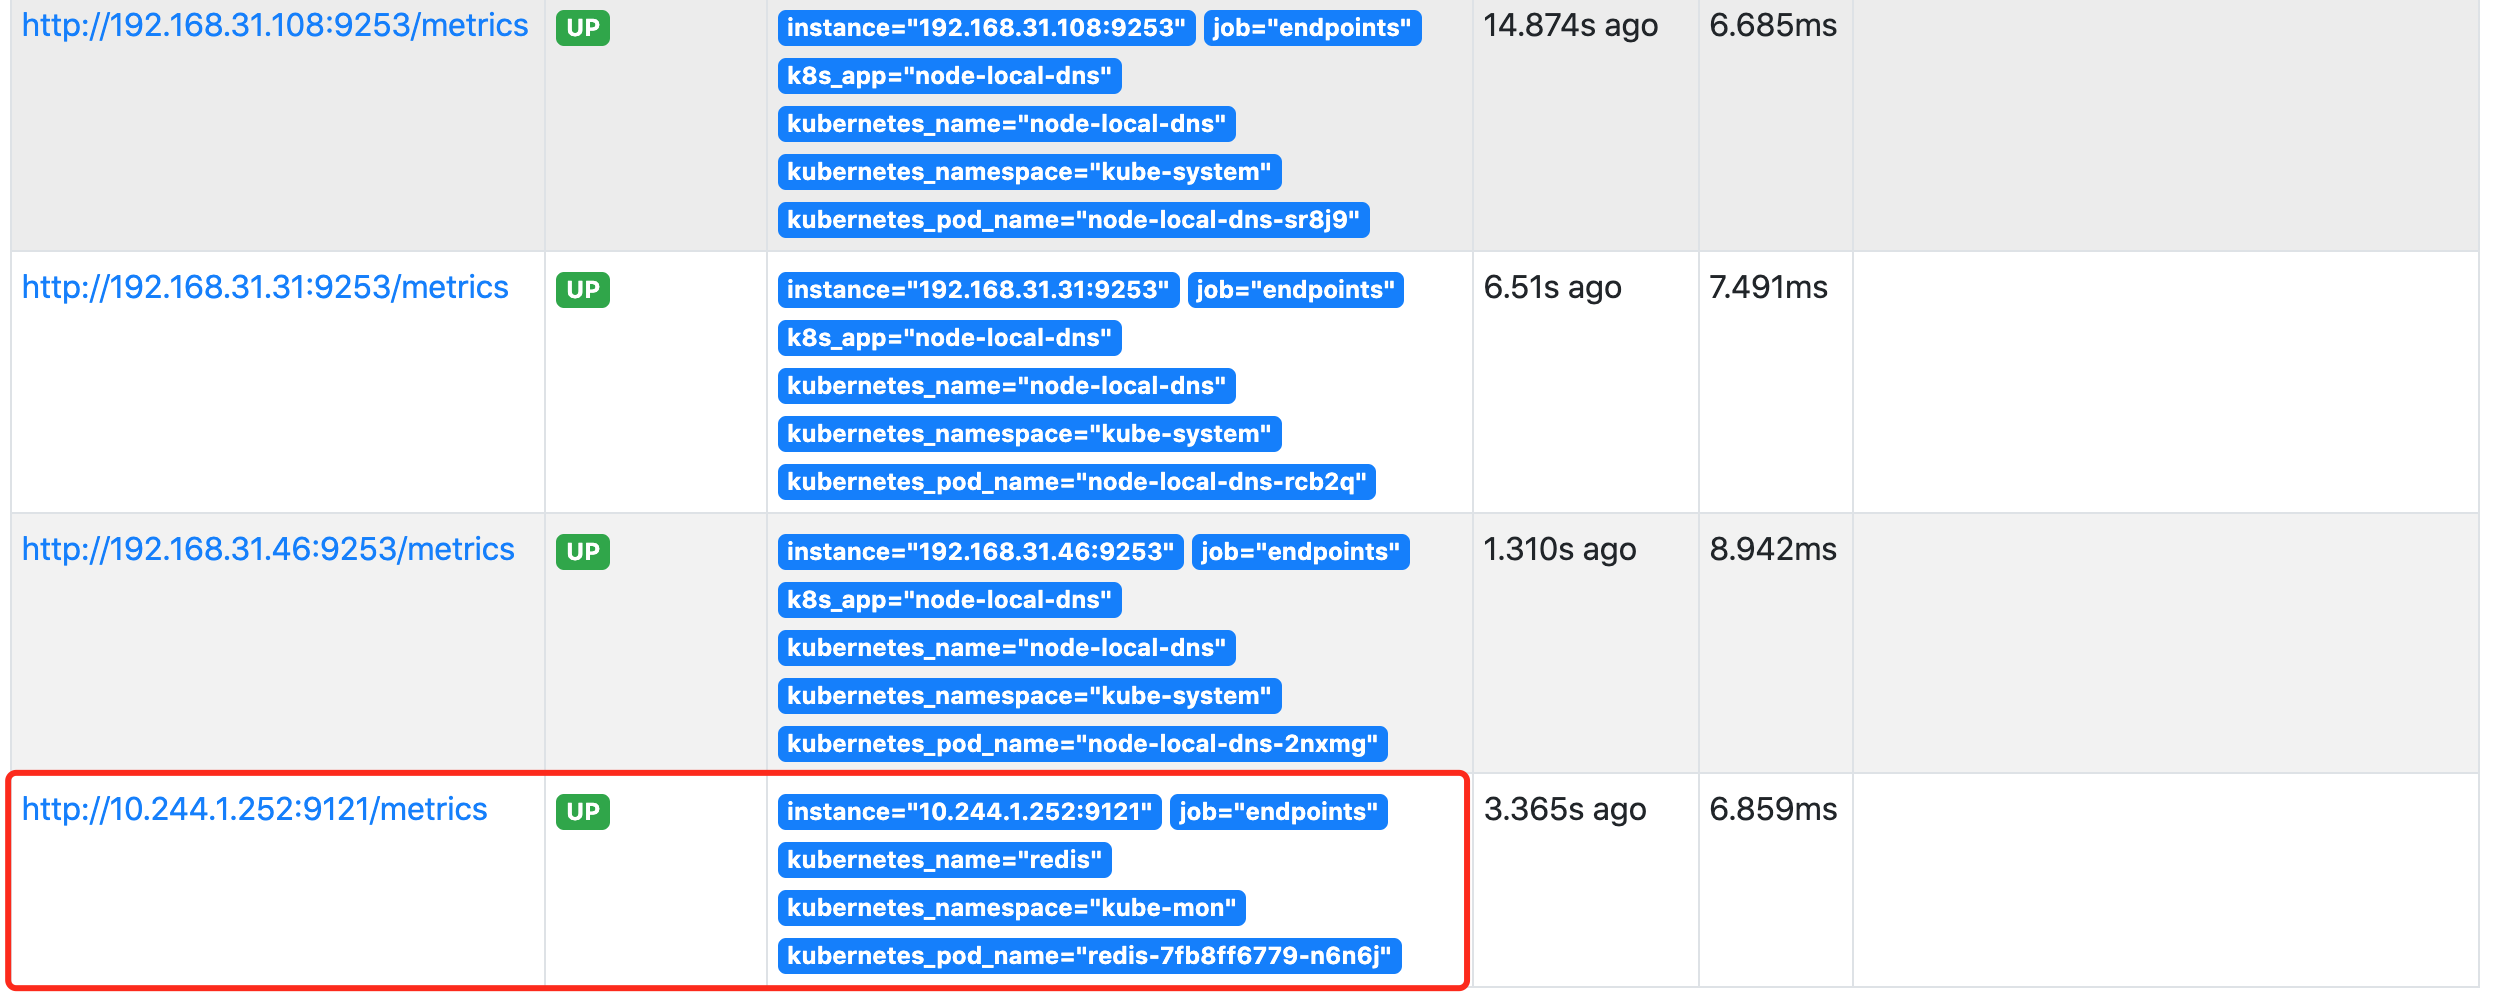
更新完成后,去 Prometheus 查看 Targets 路径,可以看到 redis 服务自动出现在了 endpoints 这个任务下面:
这样以后我们有了新的服务,如果服务本身提供了 /metrics 接口,我们就完全不需要用静态的方式去配置了,现在我们就可以将之前配置的 redis 静态配置去掉了。
同理prometheus
[root@master prometheus]# cat prometheus-svc.yaml
apiVersion: v1
kind: Service
metadata:
  name: prometheus
  namespace: monitor
  annotations:
    prometheus.io/scrape: "true"
    prometheus.io/port: "9090"
  labels:
    app: prometheus
spec:
  type: NodePort
  ports:
    - port: 9090
      targetPort: 9090
      protocol: TCP
  selector:
    app: prometheus
    component: server


