-
}
-
int main(void)
-
{
-
test();
-
return 0;
-
}
将程序编译生成可执行文件后执行: valgrind --leak-check=full ./程序名
输出结果如下:
==4832== Memcheck, a memory error detector
==4832== Copyright © 2002-2010, and GNU GPL’d, by Julian Seward et al.
==4832== Using Valgrind-3.6.1 and LibVEX; rerun with -h for copyright info
==4832== Command: ./tmp
==4832==
==4832== Invalid write of size 4 // 内存越界
==4832== at 0x804843F: test (in /home/yanghao/Desktop/testC/testmem/tmp)
==4832== by 0x804848D: main (in /home/yanghao/Desktop/testC/testmem/tmp)
==4832== Address 0x41a6050 is 0 bytes after a block of size 40 alloc’d
==4832== at 0x4026864: malloc (vg_replace_malloc.c:236)
==4832== by 0x8048435: test (in /home/yanghao/Desktop/testC/testmem/tmp)
==4832== by 0x804848D: main (in /home/yanghao/Desktop/testC/testmem/tmp)
==4832==
==4832== Source and destination overlap in memcpy(0x41a602c, 0x41a6028, 5) // 踩内存
==4832== at 0x4027BD6: memcpy (mc_replace_strmem.c:635)
==4832== by 0x8048461: test (in /home/yanghao/Desktop/testC/testmem/tmp)
==4832== by 0x804848D: main (in /home/yanghao/Desktop/testC/testmem/tmp)
==4832==
==4832== Invalid free() / delete / delete[] // 重复释放
==4832== at 0x4025BF0: free (vg_replace_malloc.c:366)
==4832== by 0x8048477: test (in /home/yanghao/Desktop/testC/testmem/tmp)
==4832== by 0x804848D: main (in /home/yanghao/Desktop/testC/testmem/tmp)
==4832== Address 0x41a6028 is 0 bytes inside a block of size 40 free’d
==4832== at 0x4025BF0: free (vg_replace_malloc.c:366)
==4832== by 0x804846C: test (in /home/yanghao/Desktop/testC/testmem/tmp)
==4832== by 0x804848D: main (in /home/yanghao/Desktop/testC/testmem/tmp)
==4832==
==4832== Use of uninitialised value of size 4 // 非法指针
==4832== at 0x804847B: test (in /home/yanghao/Desktop/testC/testmem/tmp)
==4832== by 0x804848D: main (in /home/yanghao/Desktop/testC/testmem/tmp)
==4832==
==4832==
==4832== Process terminating with default action of signal 11 (SIGSEGV) //由于非法指针赋值导致的程序崩溃
==4832== Bad permissions for mapped region at address 0x419FFF4
==4832== at 0x804847B: test (in /home/yanghao/Desktop/testC/testmem/tmp)
==4832== by 0x804848D: main (in /home/yanghao/Desktop/testC/testmem/tmp)
==4832==
==4832== HEAP SUMMARY:
==4832== in use at exit: 0 bytes in 0 blocks
==4832== total heap usage: 1 allocs, 2 frees, 40 bytes allocated
==4832==
==4832== All heap blocks were freed – no leaks are possible
==4832==
==4832== For counts of detected and suppressed errors, rerun with: -v
==4832== Use --track-origins=yes to see where uninitialised values come from
==4832== ERROR SUMMARY: 4 errors from 4 contexts (suppressed: 11 from 6)
Segmentation fault
从valgrind的检测输出结果看,这几个错误都找了出来。
2.Callgrind
和gprof类似的分析工具,但它对程序的运行观察更是入微,能给我们提供更多的信息。和gprof不同,它不需要在编译源代码时附加特殊选项,但加上调试选项是推荐的。Callgrind收集程序运行时的一些数据,建立函数调用关系图,还可以有选择地进行cache模拟。在运行结束时,它会把分析数据写入一个文件。callgrind_annotate可以把这个文件的内容转化成可读的形式。
生成可视化的图形需要下载gprof2dot:[http://jrfonseca.googlecode.com/svn/trunk/gprof2dot/gprof2dot.py](()
这是个[Python](()脚本,把它下载之后修改其权限chmod +7 gprof2dot.py ,并把这个脚本添加到$PATH路径中的任一文件夹下,我是将它放到了/usr/bin目录下,这样就可以直接在终端下执行gprof2dot.py了。
Callgrind可以生成程序性能分析的图形,首先来说说程序性能分析的工具吧,通常可以使用gnu自带的gprof,它的使用方法是:在编译程序时添加-pg参数,例如:
[plain] [view plain](() [copy](()
-
#include <stdio.h>
-
#include <malloc.h>
-
void test()
-
{
-
sleep(1);
-
}
-
void f()
-
{
-
int i;
-
for( i = 0; i < 5; i ++)
-
test();
-
}
-
int main()
-
{
-
f();
-
printf(“process is over!\n”);
-
return 0;
-
}
首先执行 gcc -pg -o tmp tmp.c,然后运行该程序./tmp,程序运行完成后会在当前目录下生成gmon.out文件(这个文件gprof在分析程序时需要),
再执行gprof ./tmp | gprof2dot.py |dot -Tpng -o report.png,打开 report.png结果:
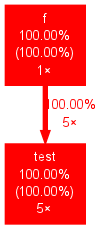
显示test被调用了5次,程序中耗时所占百分比最多的是test函数。
再来看 Callgrind的生成调用图过程吧,执行:valgrind --tool=callgrind ./tmp,执行完成后在目录下生成"callgrind.out.XXX"的文件这是分析文件,可以直接利用:callgrind_annotate callgrind.out.XXX 打印结果,也可以使用:gprof2dot.py -f callgrind callgrind.out.XXX |dot -Tpng -o report.png 来生成图形化结果:
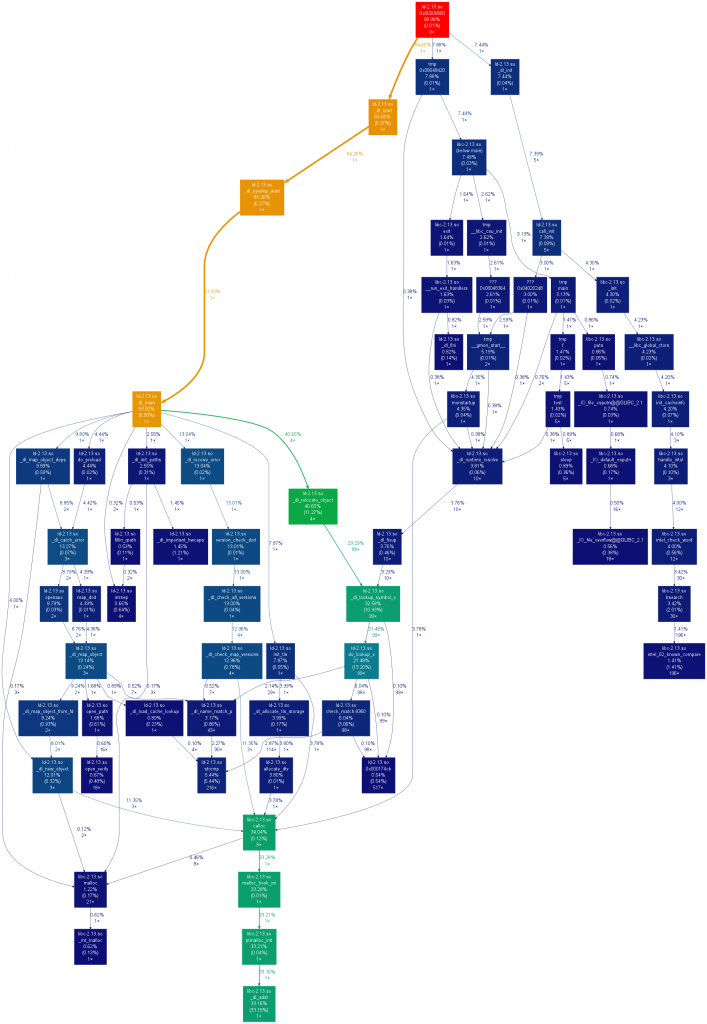
它生成的结果非常详细,甚至连函数入口,及库函数调用都标识出来了。
3.Cachegrind
Cache分析器,它模拟CPU中的一级缓存I1,Dl和二级缓存,能够精确地指出程序中cache的丢失和命中。如果需要,它还能够为我们提供cache丢失次数,内存引用次数,以及每行代码,每个函数,每个模块,整个程序产生的指令数。这对优化程序有很大的帮助。
作一下广告:valgrind自身利用该工具在过去几个月内使性能提高了25%-30%。据早先报道,kde的开发team也对valgrind在提高kde性能方面的帮助表示感谢。
它的使用方法也是:valgrind --tool=cachegrind 程序名,
4.Helgrind
它主要用来检查多线程程序中出现的竞争问题。Helgrind寻找内存中被多个线程访问,而又没有一贯加锁的区域,这些区域往往是线程之间失去同步的地方,而且会导致难以发掘的错误。Helgrind实现了名为“Eraser”的竞争检测[算法]((),并做了进一步改进,减少了报告错误的次数。不过,Helgrind仍然处于实验阶段。
首先举一个竞态的例子吧:
[plain] [view plain](() [copy](()
-
#include <stdio.h>
-
#include <pthread.h>
-
#define NLOOP 50
-
int counter = 0; /* incremented by threads */
-
void *threadfn(void *);
-
int main(int argc, char **argv)
-
{
-
pthread_t tid1, tid2,tid3;
-
pthread_create(&tid1, NULL, &threadfn, NULL);
-
pthread_create(&tid2, NULL, &threadfn, NULL);
-
pthread_create(&tid3, NULL, &threadfn, NULL);
-
/* wait for both threads to terminate */
-
pthread_join(tid1, NULL);
-
pthread_join(tid2, NULL);
-
pthread_join(tid3, NULL);
-
return 0;
-
}
-
void *threadfn(void *vptr)
-
{
-
int i, val;
-
for (i = 0; i < NLOOP; i++) {
-
val = counter;
-
printf("%x: %d \n", (unsigned int)pthread_self(), val+1);
-
counter = val+1;
-
}
-
return NULL;
-
}
这段程序的 竞态在30~32行,我们想要的效果是3个线程分别对全局变量累加50次,最后全局变量的值为150,由于这里没有加锁,很明显竞态使得程序不能达到我们的 Android开源项目《ali1024.coding.net/public/P7/Android/git》 目标。我们来看Helgrind是如何帮我们检测到竞态的。 先编译程序:gcc -o test thread.c -lpthread ,然后执行:valgrind --tool=helgrind ./ test 输出结果如下:
49c0b70: 1
49c0b70: 2
==4666== Thread #3 was created
==4666== at 0x412E9D8: clone (clone.S:111)
==4666== 《Android学习笔记总结+最新移动架构视频+大厂安卓面试真题+项目实战源码讲义》开源 by 0x40494B5: pthread_create@@GLIBC_2.1 (createthread.c:256)
==4666== by 0x4026E2D: pthread_create_WRK (hg_intercepts.c:257)
==4666== by 0x4026F8B: pthread_create@* (hg_intercepts.c:288)
==4666== by 0x8048524: main (in /home/yanghao/Desktop/testC/testmem/a.out)
==4666==
==4666== Thread #2 was created
==4666== at 0x412E9D8: clone (clone.S:111)
==4666== by 0x40494B5: pthread_create@@GLIBC_2.1 (createthread.c:256)
==4666== by 0x4026E2D: pthread_create_WRK (hg_intercepts.c:257)
==4666== by 0x4026F8B: pthread_create@* (hg_intercepts.c:288)
==4666== by 0x8048500: main (in /home/yanghao/Desktop/testC/testmem/a.out)
==4666==
==4666== Possible data race during read of size 4 at 0x804a028 by thread #3
==4666== at 0x804859C: threadfn (in /home/yanghao/Desktop/testC/testmem/a.out)
《设计思想解读开源框架》
第一章、 热修复设计
-
第一节、 AOT/JIT & dexopt 与 dex2oat
-
第二节、 热修复设计之 CLASS_ISPREVERIFIED 问题
-
第三节、热修复设计之热修复原理
-
第四节、Tinker 的集成与使用(自动补丁包生成)
第二章、 插件化框架设计
-
第一节、 Class 文件与 Dex 文件的结构解读
-
第二节、 Android 资源加载机制详解
-
第三节、 四大组件调用原理
-
第四节、 so 文件加载机制
-
第五节、 Android 系统服务实现原理

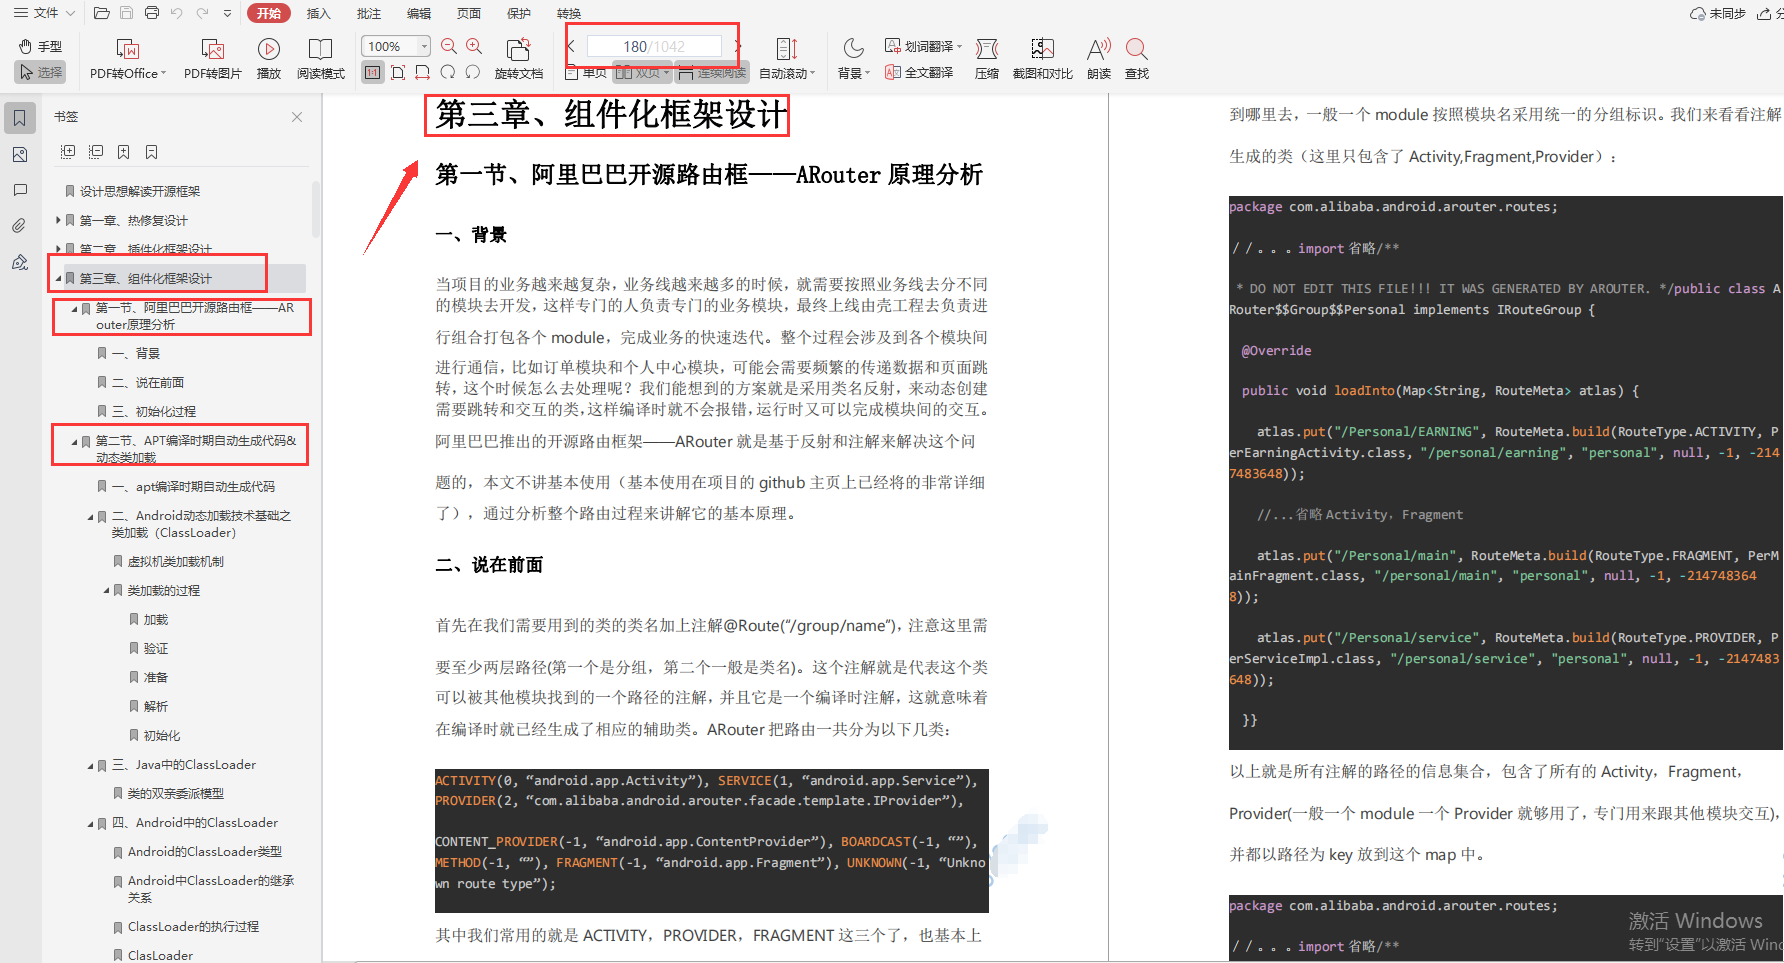
第三章、 组件化框架设计
-
第一节、阿里巴巴开源路由框——ARouter 原理分析
-
第二节、APT 编译时期自动生成代码&动态类加载
-
第三节、 Java SPI 机制
-
第四节、 AOP&IOC
-
第五节、 手写组件化架构
第四章、图片加载框架
-
第一节、图片加载框架选型
-
第二节、Glide 原理分析
-
第三节、手写图片加载框架实战

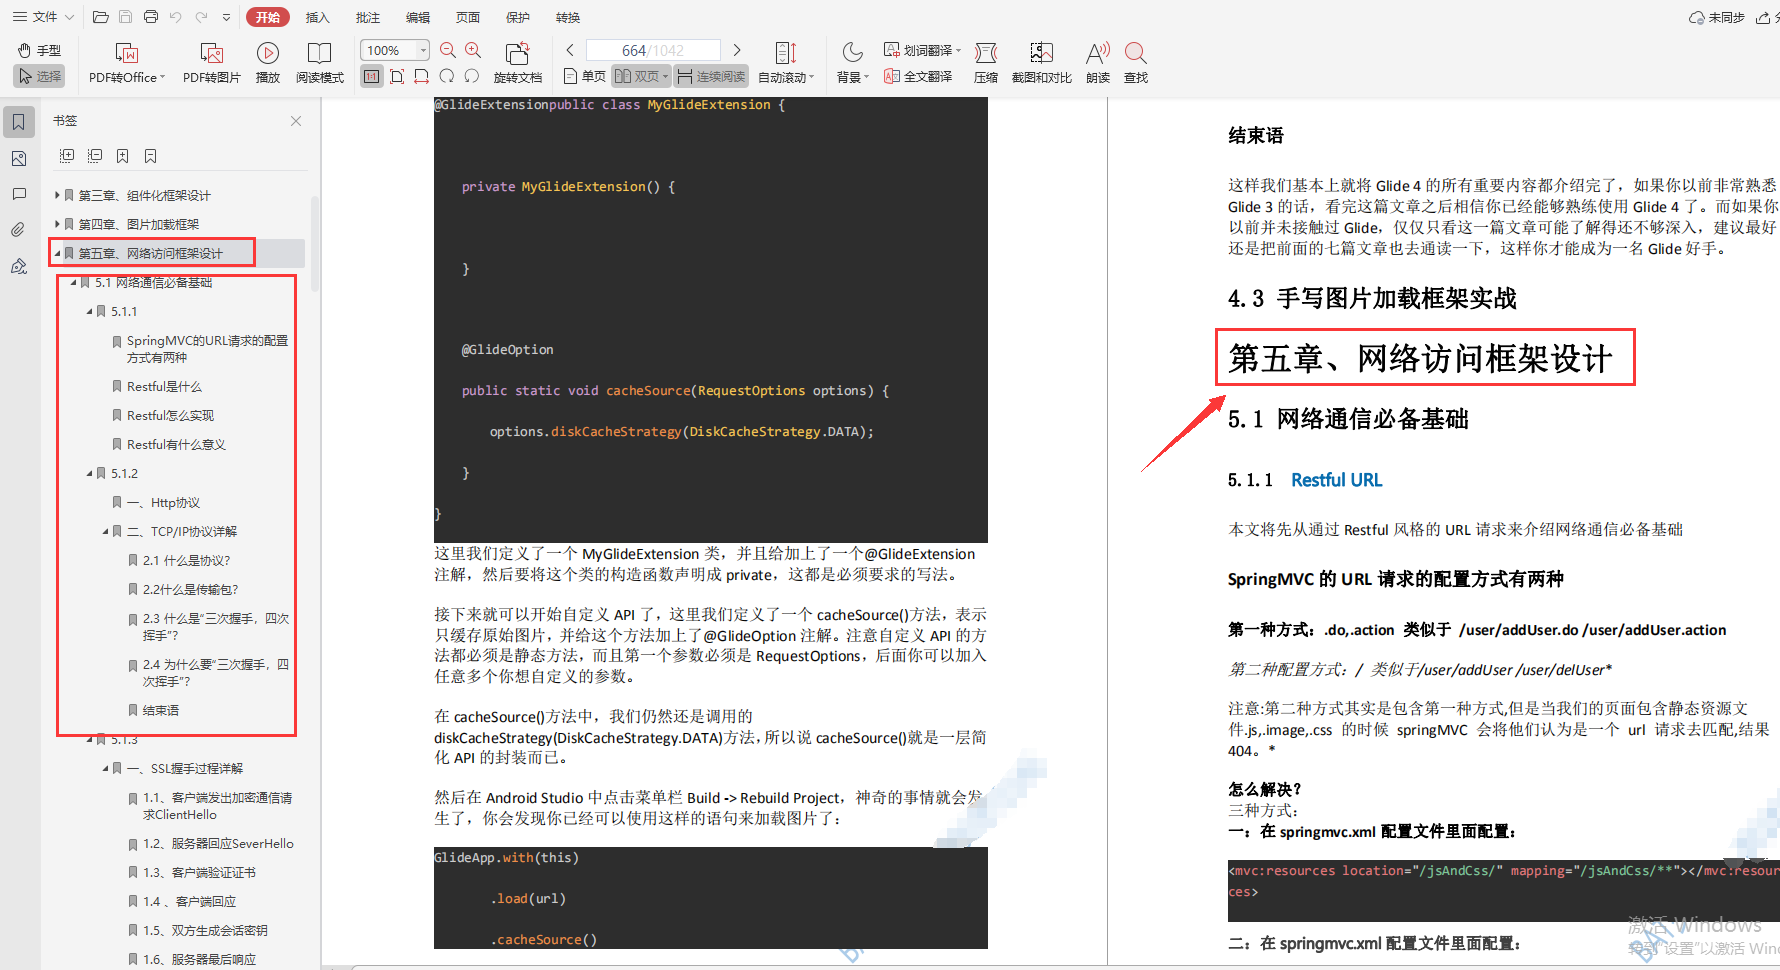
第五章、网络访问框架设计
-
第一节、网络通信必备基础
-
第二节、OkHttp 源码解读
-
第三节、Retrofit 源码解析
第六章、 RXJava 响应式编程框架设计
-
第一节、链式调用
-
第二节、 扩展的观察者模式
-
第三节、事件变换设计
-
第四节、Scheduler 线程控制

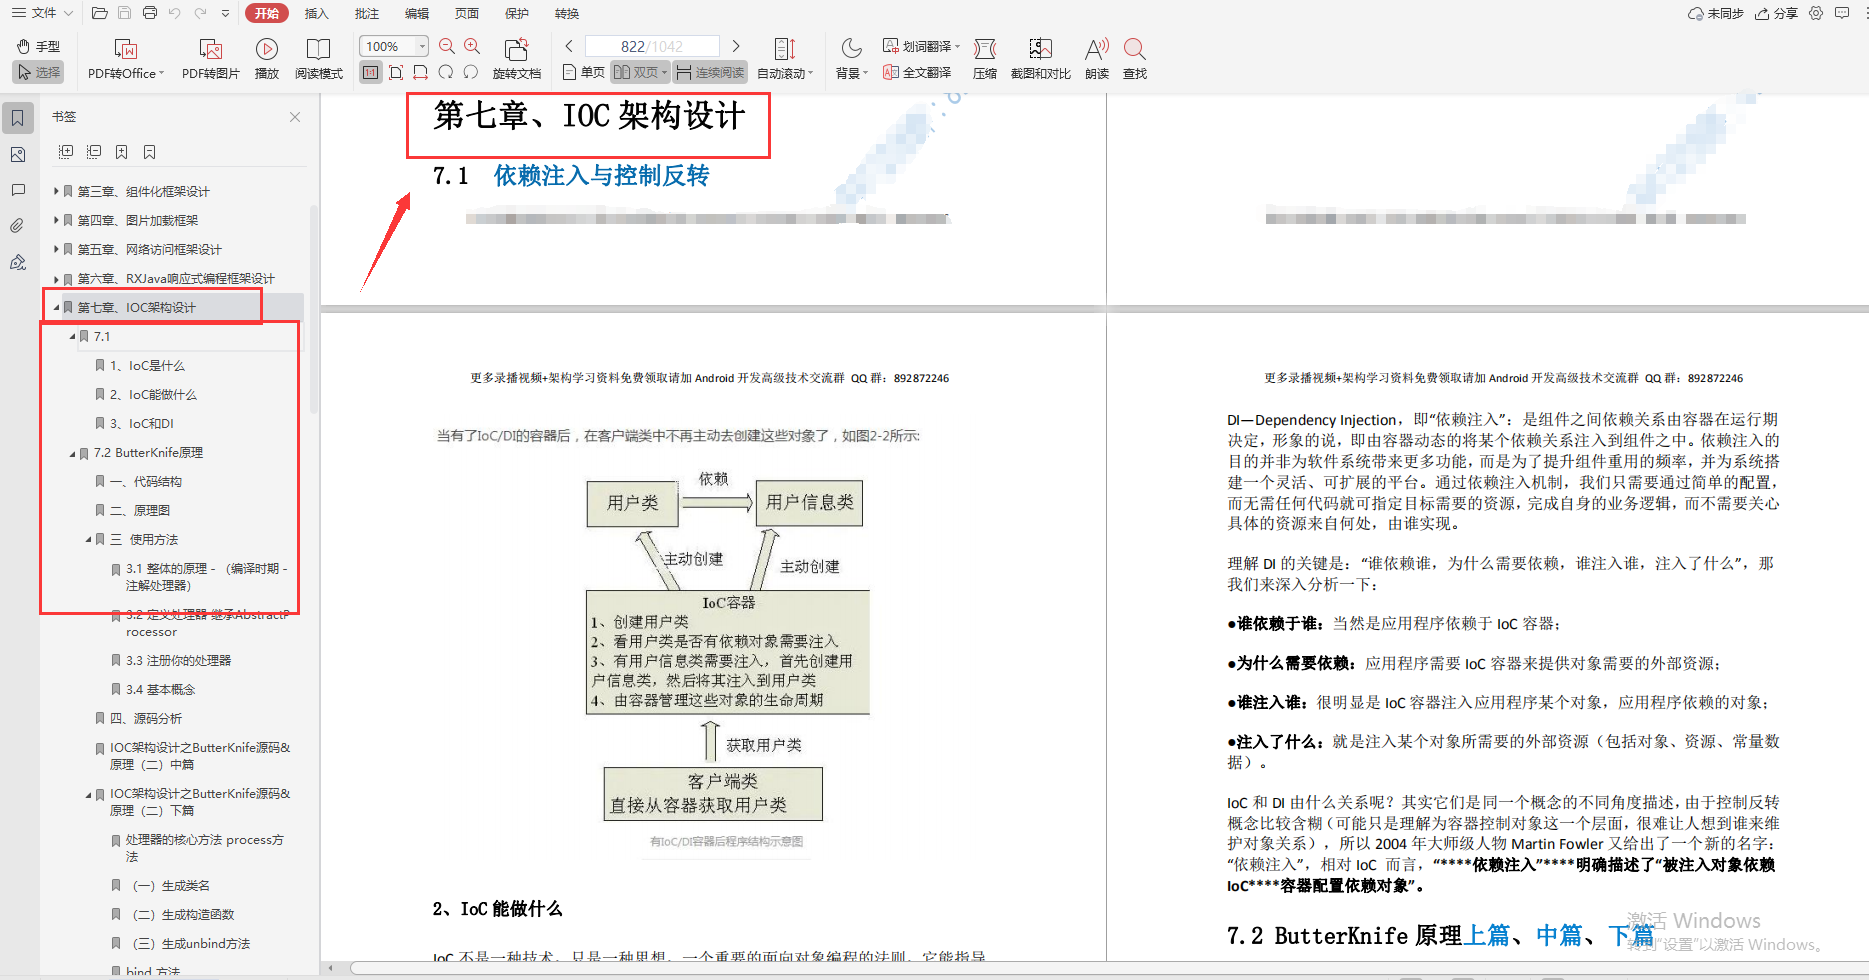
第七章、 IOC 架构设计
-
第一节、 依赖注入与控制反转
-
第二节、ButterKnife 原理上篇、中篇、下篇
-
第三节、Dagger 架构设计核心解密
第八章、 Android 架构组件 Jetpack
-
第一节、 LiveData 原理
-
第二节、 Navigation 如何解决 tabLayout 问题
-
第三节、 ViewModel 如何感知 View 生命周期及内核原理
-
第四节、 Room 架构方式方法
-
第五节、 dataBinding 为什么能够支持 MVVM
-
第六节、 WorkManager 内核揭秘
-
第七节、 Lifecycles 生命周期

本文包含不同方向的自学编程路线、面试题集合/面经、及系列技术文章等,资源持续更新中…
[外链图片转存中…(img-nQZ3HANq-1650016458107)]第八章、 Android 架构组件 Jetpack
-
第一节、 LiveData 原理
-
第二节、 Navigation 如何解决 tabLayout 问题
-
第三节、 ViewModel 如何感知 View 生命周期及内核原理
-
第四节、 Room 架构方式方法
-
第五节、 dataBinding 为什么能够支持 MVVM
-
第六节、 WorkManager 内核揭秘
-
第七节、 Lifecycles 生命周期
[外链图片转存中…(img-VRzJY5l9-1650016458107)]
本文包含不同方向的自学编程路线、面试题集合/面经、及系列技术文章等,资源持续更新中…
[外链图片转存中…(img-hiYAdVgY-1650016458107)]


