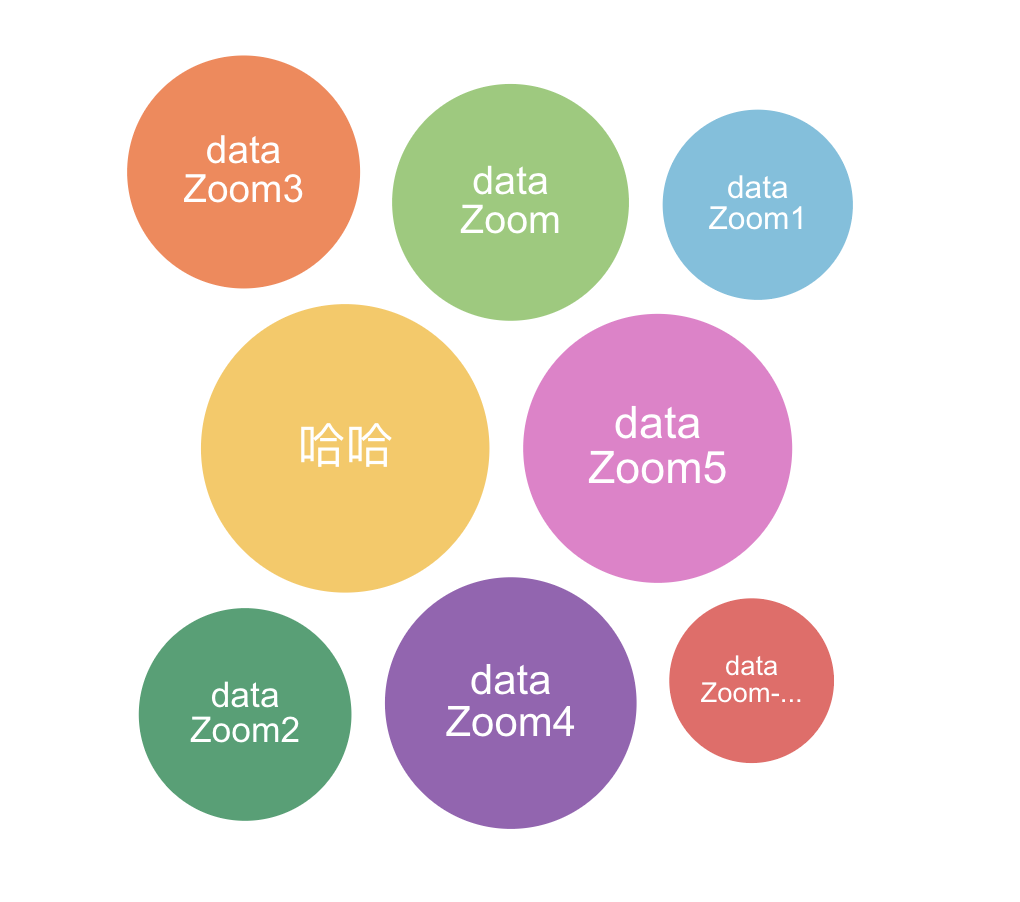
效果图

借助Echarts中提供的样例完成,官网样例可自行前往
官网链接放下面啦!!
Examples - Apache ECharts

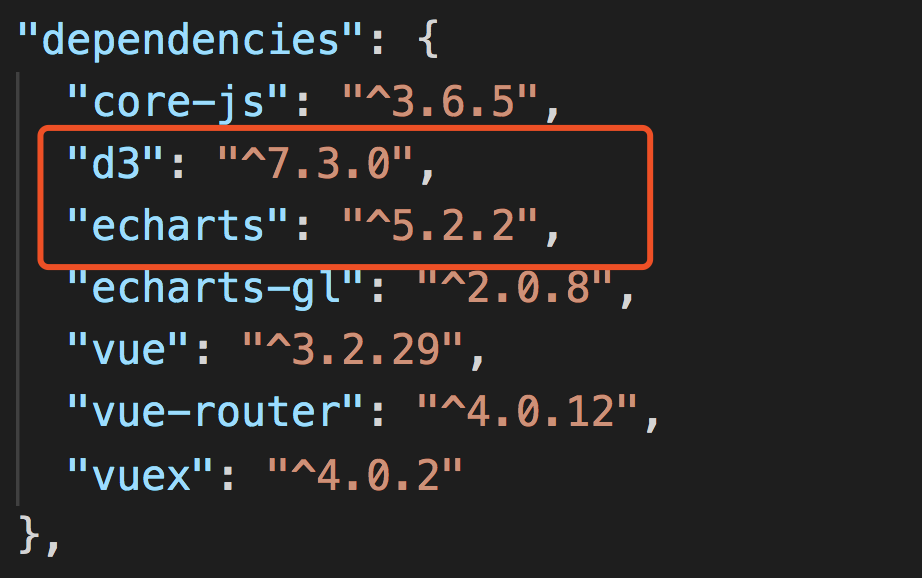
使用版本
完整代码如下
<!-- d3js 气泡图 -->
<template>
  <div id="bubble" style="width: 500px;height:500px"></div>
</template>

<script>
import * as echarts from 'echarts/core';
import {
  DatasetComponent,
  TooltipComponent,
  VisualMapComponent
} from 'echarts/components';
import { CustomChart } from 'echarts/charts';
import { CanvasRenderer } from 'echarts/renderers';
echarts.use([
  DatasetComponent,
  TooltipComponent,
  VisualMapComponent,
  CustomChart,
  CanvasRenderer
]);
import * as d3 from 'd3';
export default {
  data() {
    return {
      option: {},
      colorList: ['#5470c6', '#91cc75', '#fac858', '#ee6666', '#73c0de', '#3ba272', '#fc8452', '#9a60b4', '#ea7ccc']
    };
  },

  mounted() {
    let that = this
    let seriesData = [
      {
        depth: 0,
        id: 'option',
        index: 0,
        value: 0
      },
      {
        depth: 1,
        id: 'option.dataZoom',
        index: 1,
        value: 62
      },
      {
        depth: 1,
        id: 'option.哈哈',
        index: 2,
        value: 92
      },
      {
        depth: 1,
        id: 'option.dataZoom-inside',
        index: 3,
        value: 30
      },
      {
        depth: 1,
        id: 'option.dataZoom1',
        index: 4,
        value: 40
      },
      {
        depth: 1,
        id: 'option.dataZoom2',
        index: 5,
        value: 50
      },
      {
        depth: 1,
        id: 'option.dataZoom3',
        index: 5,
        value: 60
      },
      {
        depth: 1,
        id: 'option.dataZoom4',
        index: 5,
        value: 70
      },
      {
        depth: 1,
        id: 'option.dataZoom5',
        index: 5,
        value: 80
      }
    ];
    let displayRoot = stratify1();
    function stratify1() {
      return d3
        .stratify()
        .parentId(function (d) {

          return d.id.substring(0, d.id.lastIndexOf('.'));
        })(seriesData)
        .sum(function (d) {

          return d.value || 0;
        })
        .sort(function (a, b) {
          return b.value - a.value;
        });
    }
    function overallLayout(params, api) {

      let context = params.context;
      d3
        .pack()
        .size([api.getWidth() - 2, api.getHeight() - 2])
        .padding(0)(displayRoot);
      context.nodes = {};

      displayRoot.descendants().forEach(function (node) {

        context.nodes[node.id] = node;
      });
    }
    function renderItem(params, api) {
      let context = params.context;
      let idx = params.dataIndex;

      // Only do that layout once in each time `setOption` called.
      // 每次调用“setOption”时,只能进行一次布局。
      if (!context.layout) {
        context.layout = true;

        overallLayout(params, api);
      }

      let nodePath = api.value('id');
      let nodeName = nodePath
        .slice(nodePath.lastIndexOf('.') + 1)
        .split(/(?=[A-Z][^A-Z])/g)
        .join('
')
      let node = context.nodes[nodePath];
      if (node.id === 'option') {
        node.r = 0
      }
      if (!node) {
        // Reder nothing.
        return;
      }

      let z2 = api.value('depth') * 2;
      return {
        type: 'circle',
        shape: {
          cx: node.x,
          cy: node.y,
          r: node.r
        },
        // transition: ['shape'],
        z2: z2,
        textContent: {
          type: 'text',
          style: {
            // transition: isLeaf ? 'fontSize' : null,
            text: nodeName,
            fill: '#fff',
            fontFamily: 'Arial',
            width: node.r * 1.3,
            overflow: 'truncate',
            fontSize: node.r / 3
          },
          emphasis: {
            style: {
              overflow: null,
              fontSize: Math.max(node.r / 3, 12)
            }
          }
        },
        textConfig: {
          position: 'inside'
        },
        style: {
          fill: that.colorList[idx % that.colorList.length]
        },
        emphasis: {
          style: {
            fontFamily: 'Arial',
            fontSize: 12,
            shadowBlur: 20,
            shadowOffsetX: 3,
            shadowOffsetY: 5,
            shadowColor: 'rgba(0,0,0,0.3)'
          }
        }
      };
    }
    this.option = {
      dataset: {
        source: seriesData
      },
      tooltip: {},
      hoverLayerThreshold: Infinity,
      series: [{
        type: 'custom',
        colorBy: 'data',
        renderItem: renderItem,
        progressive: 0,
        coordinateSystem: 'none',
        encode: {
          tooltip: 'value',
          itemName: 'id'
        }
      }]
    }
    this.initEcharts()
  },

  methods: {
    initEcharts() {
      let myChart = echarts.init(document.getElementById('bubble'))
      myChart.setOption(this.option)
    }
  }
}

</script>
注意点
一、如何实现的最大的背景图不显示
我这里是加了这个来判断了,大家用数据可以自己改成想要的判断,原则就是一个让对应圆的半径为0即可
(本人不太熟悉D3.js如果有大神知道如何写更好请赐教,研究了一天我真的哭了只能用这种方式了,太菜了)
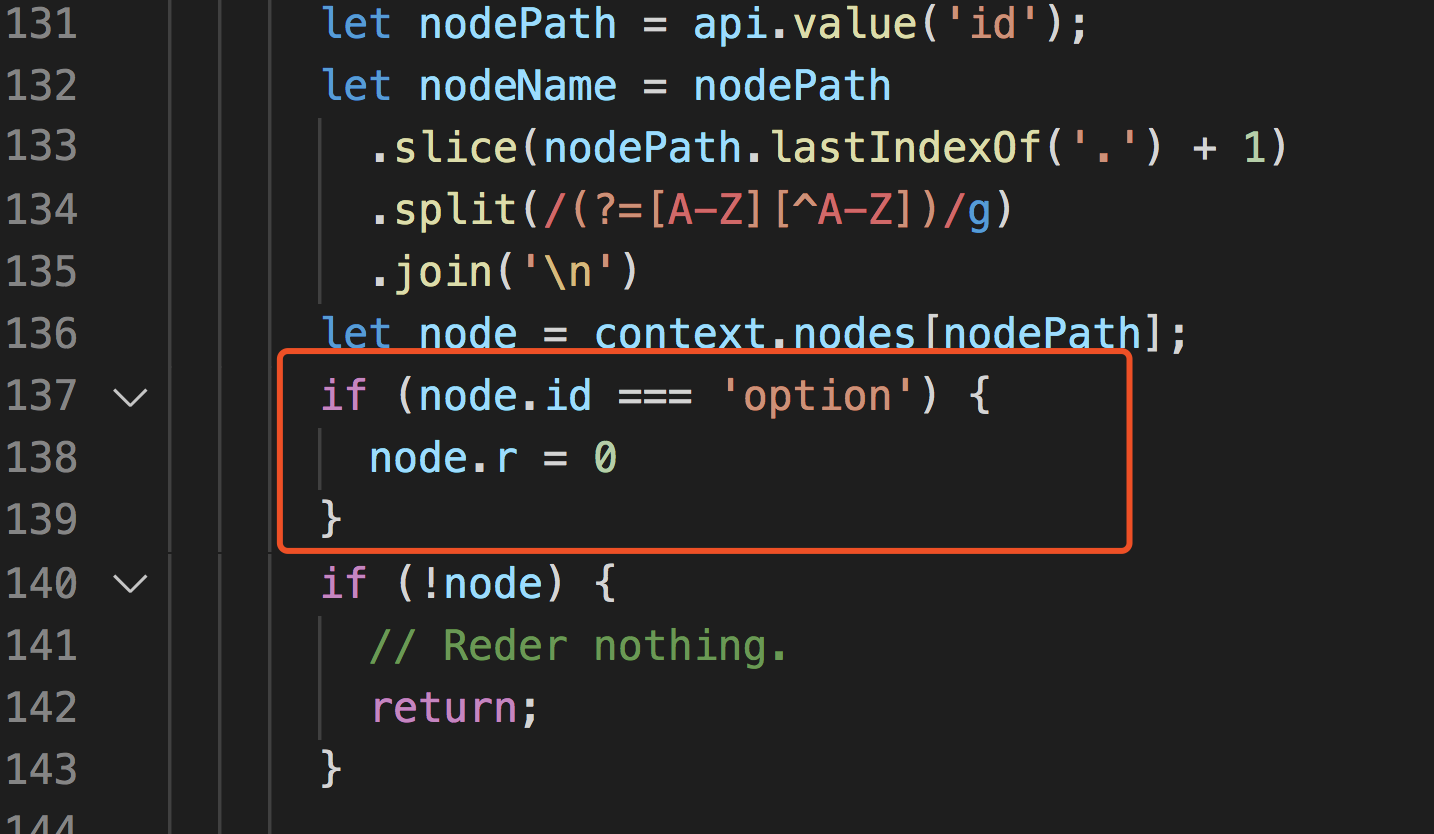
下面是注掉红框后的显示效果

二、圆圈的间距
使用padding括号中的值来改变

改成 padding(20)(displayRoot)效果图如下