grafana是一个非常优秀的图标展示工具,通常用来监控系统的展示页面。今天,我们来讨论一个场景:假设我们有大量的dashboard,当我们业务需要重新部署时,能否自动化的对其进行迁移,比如:创建user、创建datasource、创建dashboard等。
说明:本文用到grafana时grafana-5.4.4
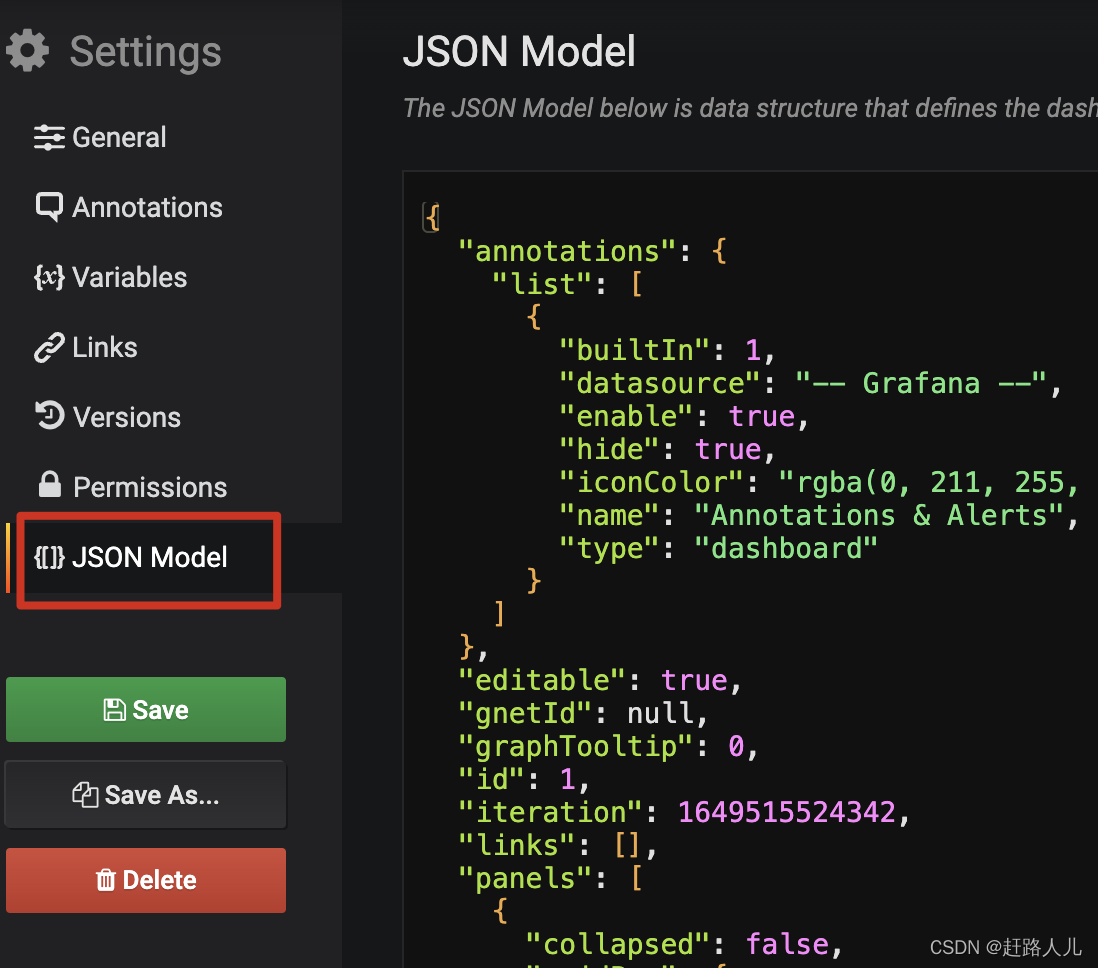
一、通过json model方式手动导入、导出:
grafana支持将dashboard导出为json model格式的数据,然后在新的grafana中利用import方式来创建dashboard,例如:
导入:
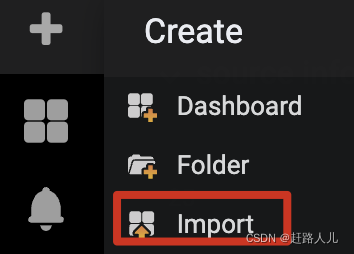
这种方式虽然也比较方便,但是仍然需要人工操作。
二、通过http api的方式创建user、dashboard和导入dashboard
我们系统使用了graphite作为时许数据库,使用grafana展示监控数据。当我们将这套监控系统迁移时,希望做到自动化:创建user、创建datasource、创建dashboard... 因此,调研了grafana提供的http api,来实现上述需求。
1、http api简单介绍:
grafana官网非常详细的介绍了http api各种功能,这里我们重点介绍下如何使用:https://grafana.com/docs/grafana/latest/http_api/dashboard/
1.1)申请api key:
我们都知道,要想掉用grafana的api需要鉴权,可以进去grafan页面,按照下面方式申请api key:
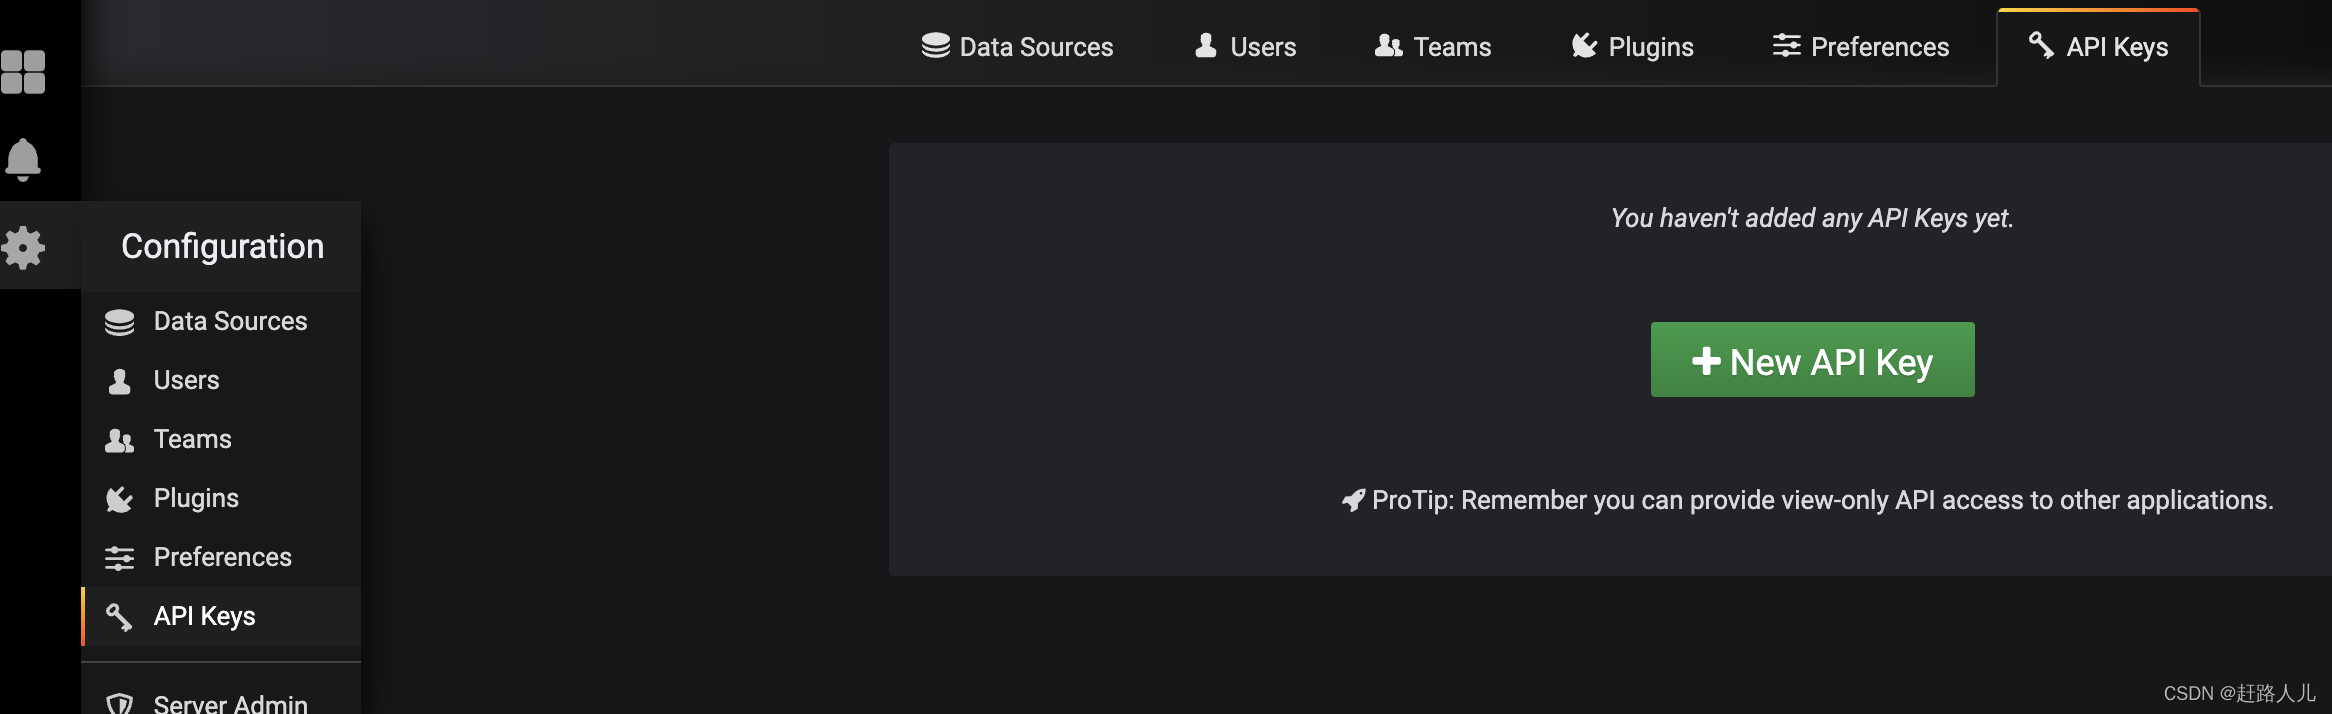
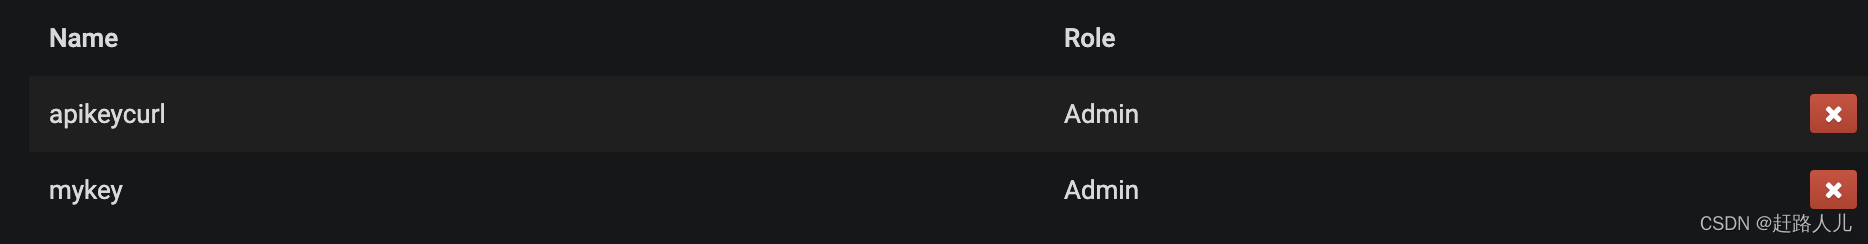
点击new api key,可以选择role,某些api只有admin权限可使用:
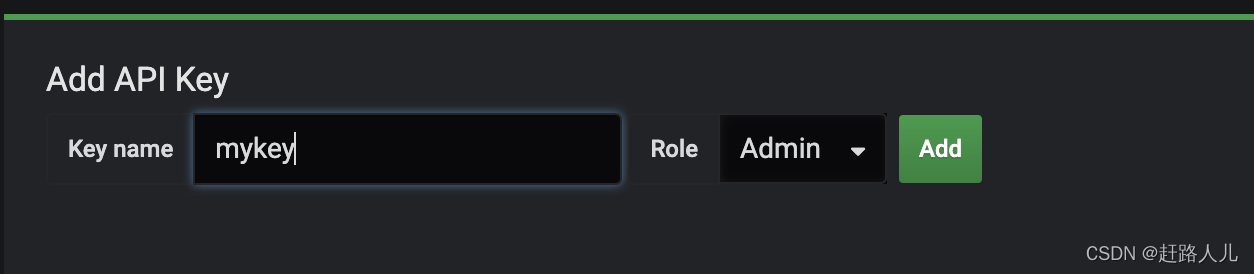 点击Add后保存好api key(该界面只会出现一次),然后按照下面方式访问:
curl -H "Authorization: Bearer eyJrIjoiaWZZdHBJdW16blFzbjIyMWl4eVQ2Q05QdGljOWJ6WjMiLCJuIjoibXlrZXkiLCJpZCI6MX0=" http://127.0.0.1/api/dashboards/home注:Bearer 是个固定的,和我们申请的key name没有关系。
1.2)如何通过api的方式申请api key?
我们知道,要做到完全自动化就不能有人工操作,查看grafana官网,是可以通过api的方式来申请API key的。方式如下:
$ curl -X POST -H "Content-Type: application/json" -d '{"name":"apikeycurl", "role": "Admin"}' http://admin:admin@127.0.0.1/api/auth/keys
{"name":"apikeycurl","key":"eyJrIjoiSUt3WUpaMlRRSnM3ZW1xM3hDbFFKbjM5WVBJRkdtYW8iLCJuIjoiYXBpa2V5Y3VybCIsImlkIjoxfQ=="}
生成了名为apikeycurl的API Key:
 我们保存响应中的key值,前面拼接好固定的Bearer,就可以访问了,例如:
curl -H "Authorization: Bearer eyJrIjoiSUt3WUpaMlRRSnM3ZW1xM3hDbFFKbjM5WVBJRkdtYW8iLCJuIjoiYXBpa2V5Y3VybCIsImlkIjoxfQ==" http://127.0.0.1/api/dashboards/home1.3)admin http api的使用:
通过上面方式获取到了api key,接下来每次请求带上api key就可以使用grafana提供的api来完成我们要完成的功能了。其实,还有一种方式更加的简洁,那就是admin http api。
细心的同学已经发现了,我们通过api来申请api key的时候,在请求中使用了http://admin:admin@ip/...的方式,这其实就是admin http api,其中admin:admin表示的是admin用户和密码,在我们安装grafana时可以修改config/default.ini文件制定admin用户密码。
接下来的操作,我们都是通过admin http api的方式操作。
2、创建用户:
curl -X POST -H "Content-Type: application/json" \
> -d '{"name":"User","email":"ttengine@graf.com","login":"ttengine","password":"passwOrd"}' \
> "http://admin:admin@127.0.0.1/api/admin/users"
{"id":3,"message":"User created"}
3、创建数据源:
这里我们以graphite为例子:
$ curl -X POST -H "Content-Type: application/json" -d '{"name":"my_datasource","type":"graphite","url":"http://127.0.0.1:81","access":"proxy","basicAuth":false}' "http://admin:admin@127.0.0.1/api/datasources"
{"datasource":{"id":2,"orgId":1,"name":"my_datasource","type":"graphite","typeLogoUrl":"","access":"proxy","url":"http://127.0.0.1:81","password":"","user":"","database":"","basicAuth":false,"basicAuthUser":"","basicAuthPassword":"","withCredentials":false,"isDefault":false,"secureJsonFields":{},"version":1,"readOnly":false},"id":2,"message":"Datasource added","name":"my_datasource"}
至于post的json格式,我们可以在一个已经创建好datasource的grafana上,执行以下api来获取对应datasource的数据:
curl -X GET  "http://admin:admin@127.0.0.1/api/datasources"
[{"id":2,"orgId":1,"name":"my_datasource","type":"graphite","typeLogoUrl":"public/app/plugins/datasource/graphite/img/graphite_logo.png","access":"proxy","url":"http://127.0.0.1:81","password":"","user":"","database":"","basicAuth":false,"isDefault":false,"jsonData":{},"readOnly":false},{"id":1,"orgId":1,"name":"test_datasource","type":"graphite","typeLogoUrl":"public/app/plugins/datasource/graphite/img/graphite_logo.png","access":"proxy","url":"http://127.0.0.1:81","password":"","user":"","database":"","basicAuth":false,"isDefault":false,"jsonData":{},"readOnly":false}]
4、创建dashboard
首先在grafana中通过json model来导出我们的dashboard(带有variable),格式如下:
{
  "annotations": {
    "list": [
      {
        "builtIn": 1,
        "datasource": "-- Grafana --",
        "enable": true,
        "hide": true,
        "iconColor": "rgba(0, 211, 255, 1)",
        "name": "Annotations & Alerts",
        "type": "dashboard"
      }
    ]
  },
  "editable": true,
  "gnetId": null,
  "graphTooltip": 0,
  "id": 1,
  "iteration": 1649519055915,
  "links": [],
  "panels": [
    {
      "collapsed": false,
      "gridPos": {
        "h": 1,
        "w": 24,
        "x": 0,
        "y": 0
      },
      "id": 7,
      "panels": [],
      "targets": [
        {
          "refId": "A"
        }
      ],
      "title": "source info",
      "type": "row"
    },
    {
      "aliasColors": {},
      "bars": false,
      "dashLength": 10,
      "dashes": false,
      "datasource": "test_datasource",
      "fill": 0,
      "gridPos": {
        "h": 7,
        "w": 24,
        "x": 0,
        "y": 1
      },
      "id": 2,
      "legend": {
        "avg": false,
        "current": false,
        "max": false,
        "min": false,
        "show": true,
        "total": true,
        "values": true
      },
      "lines": true,
      "linewidth": 1,
      "links": [],
      "nullPointMode": "connected",
      "percentage": false,
      "pointradius": 5,
      "points": false,
      "renderer": "flot",
      "seriesOverrides": [],
      "spaceLength": 10,
      "stack": false,
      "steppedLine": false,
      "targets": [
        {
          "refCount": 0,
          "refId": "A",
          "target": "alias(sumSeries(flink-datahub.$job_name.*.kafka_source.count), 'source_count')"
        },
        {
          "refCount": 0,
          "refId": "B",
          "target": "alias(sumSeries(flink-datahub.$job_name.*.etl_success.count), 'etl_success_count')"
        },
        {
          "refCount": 0,
          "refId": "C",
          "target": "alias(sumSeries(flink-datahub.$job_name.*.etl_null.count), 'etl_null')"
        }
      ],
      "thresholds": [],
      "timeFrom": null,
      "timeRegions": [],
      "timeShift": null,
      "title": "接收数据量",
      "tooltip": {
        "shared": true,
        "sort": 0,
        "value_type": "individual"
      },
      "type": "graph",
      "xaxis": {
        "buckets": null,
        "mode": "time",
        "name": null,
        "show": true,
        "values": []
      },
      "yaxes": [
        {
          "format": "short",
          "label": null,
          "logBase": 1,
          "max": null,
          "min": null,
          "show": true
        },
        {
          "format": "short",
          "label": null,
          "logBase": 1,
          "max": null,
          "min": null,
          "show": true
        }
      ],
      "yaxis": {
        "align": false,
        "alignLevel": null
      }
    }
  ],
  "schemaVersion": 16,
  "style": "dark",
  "tags": [],
  "templating": {
    "list": [
      {
        "allValue": null,
        "current": {
          "text": "test",
          "value": "test"
        },
        "datasource": "test_datasource",
        "definition": "flink-datahub.*",
        "hide": 0,
        "includeAll": false,
        "label": null,
        "multi": false,
        "name": "job_name",
        "options": [],
        "query": "flink-datahub.*",
        "refresh": 1,
        "regex": "",
        "skipUrlSync": false,
        "sort": 0,
        "tagValuesQuery": "",
        "tags": [],
        "tagsQuery": "",
        "type": "query",
        "useTags": false
      }
    ]
  },
  "time": {
    "from": "now-6h",
    "to": "now"
  },
  "timepicker": {
    "refresh_intervals": [
      "5s",
      "10s",
      "30s",
      "1m",
      "5m",
      "15m",
      "30m",
      "1h",
      "2h",
      "1d"
    ],
    "time_options": [
      "5m",
      "15m",
      "1h",
      "6h",
      "12h",
      "24h",
      "2d",
      "7d",
      "30d"
    ]
  },
  "timezone": "",
  "title": "flink-etl",
  "uid": "u8lTX4U7k",
  "version": 2
}
将其保存成dashboard1.json,通过如下api来创建dashboard:
curl -H "Content-Type: application/json" -X POST -d @/usr/local/dashboards/dashboard1.json \
"http://admin:admin@127.0.0.1/api/dashboards/db"补充:curl发送POST请求的方式https://blog.51cto.com/u_15127561/3821868
执行上述命令,会报如下错误:
[{"fieldNames":["Dashboard"],"classification":"RequiredError","message":"Required"}]开始是因为curl post数据路径错误,导致无法找到dashboard1.json,调整后依然报错,从github上其他人报的issue:
https://github.com/grafana/grafana/issues/2816
https://github.com/grafana/grafana/issues/8193
最后发现原因是,grafana创建dashboard需要一个固定的格式:
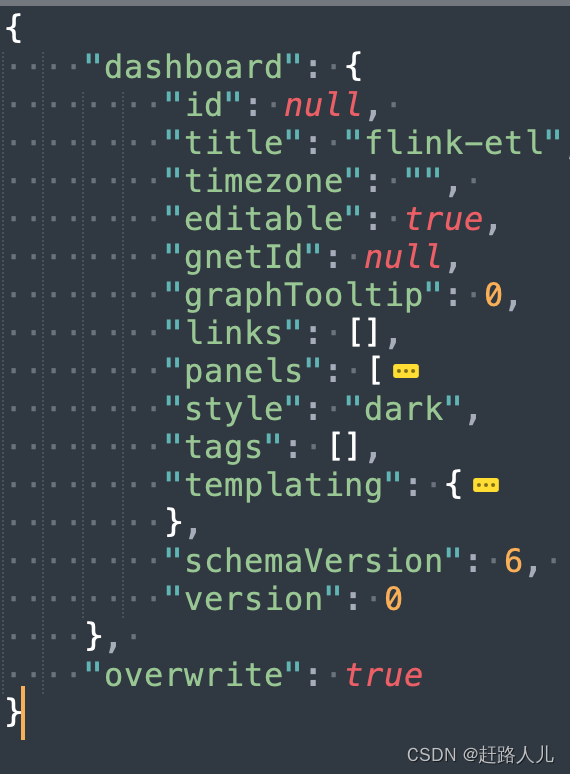
其中,panels是我们定义的各种panel信息,templating是我们定义的variable(早起grafana版本我们定义的变量就叫templateing) 。只需要将上面json中的panels和templating节点拷贝到那个格式中即可:
{
    "dashboard": {
        "id": null,
        "title": "flink-etl",
        "timezone": "",
        "editable": true,
        "gnetId": null,
        "graphTooltip": 0,
        "links": [],
        "panels": [
            {
              "collapsed": false,
              "gridPos": {
                "h": 1,
                "w": 24,
                "x": 0,
                "y": 0
              },
              "id": 7,
              "panels": [],
              "title": "source info",
              "type": "row"
            },
            {
              "aliasColors": {},
              "bars": false,
              "dashLength": 10,
              "dashes": false,
              "datasource": "test_datasource",
              "fill": 0,
              "gridPos": {
                "h": 7,
                "w": 24,
                "x": 0,
                "y": 1
              },
              "id": 2,
              "legend": {
                "avg": false,
                "current": false,
                "max": false,
                "min": false,
                "show": true,
                "total": true,
                "values": true
              },
              "lines": true,
              "linewidth": 1,
              "links": [],
              "nullPointMode": "connected",
              "percentage": false,
              "pointradius": 5,
              "points": false,
              "renderer": "flot",
              "seriesOverrides": [],
              "spaceLength": 10,
              "stack": false,
              "steppedLine": false,
              "targets": [
                {
                  "refCount": 0,
                  "refId": "A",
                  "target": "alias(sumSeries(flink-datahub.$job_name.*.kafka_source.count), 'source_count')"
                },
                {
                  "refCount": 0,
                  "refId": "B",
                  "target": "alias(sumSeries(flink-datahub.$job_name.*.etl_success.count), 'etl_success_count')"
                },
                {
                  "refCount": 0,
                  "refId": "C",
                  "target": "alias(sumSeries(flink-datahub.$job_name.*.etl_null.count), 'etl_null')"
                }
              ],
              "thresholds": [],
              "timeFrom": null,
              "timeRegions": [],
              "timeShift": null,
              "title": "接收数据量",
              "tooltip": {
                "shared": true,
                "sort": 0,
                "value_type": "individual"
              },
              "type": "graph",
              "xaxis": {
                "buckets": null,
                "mode": "time",
                "name": null,
                "show": true,
                "values": []
              },
              "yaxes": [
                {
                  "format": "short",
                  "label": null,
                  "logBase": 1,
                  "max": null,
                  "min": null,
                  "show": true
                },
                {
                  "format": "short",
                  "label": null,
                  "logBase": 1,
                  "max": null,
                  "min": null,
                  "show": true
                }
              ],
              "yaxis": {
                "align": false,
                "alignLevel": null
              }
            }
          ],
        "style": "dark",
        "tags": [],
        "templating": {
          "list": [
            {
              "allValue": null,
              "current": {
                "text": "test",
                "value": "test"
              },
              "datasource": "test_datasource",
              "definition": "flink-datahub.*",
              "hide": 0,
              "includeAll": false,
              "label": null,
              "multi": false,
              "name": "job_name",
              "options": [],
              "query": "flink-datahub.*",
              "refresh": 2,
              "regex": "",
              "skipUrlSync": false,
              "sort": 0,
              "tagValuesQuery": "",
              "tags": [],
              "tagsQuery": "",
              "type": "query",
              "useTags": false
            }
          ]
        },
        "schemaVersion": 6,
        "version": 0
    },
    "overwrite": true
}
注意:当我们导入dashboard后,在grafana上可能metrics配置有问题,原因是graphite没有数据,所以我们可以在导入dashboard之前向graphite中插入些数据:
echo "flink-datahub.test.127_0_0_1.kafka_source.count 20 `date +%s`" | nc 127.0.0.1 2003最后说一点,我们把graphite和grafana安装到一个服务器上(或者打进一个docker镜像),这时grafana可以通过127.0.0.1这个ip来请求graphite(创建的datasource使用127.0.0.1)。假设:我们docker最终提供一个对外的ip1,并且将2003暴露出去,别人就可以通过ip1:2003向graphite上报数据量,grafana通过127.0.0.1创建的datasource是可以查询到上报道的数据。
参考:https://community.influxdata.com/t/solved-cannot-import-grafana-dashboard-via-grafana-api/5538/2


