目录
配置QtChart开发环境
安装开发库
sudo apt install libqt5charts5-dev配置项目
QT += core gui charts
项目开发样例
鼠标点击的时候随机生成数据进行展示。我这里使用年销售作为样例。
X坐标时间,Y坐标为每月销售额。

代码分析
QValueAxis * mAxY = new QValueAxis();
QValueAxis * mAxX = new QValueAxis();
横纵轴设置
设置X轴以及Y轴的数据。
设置范围
mAxY->setRange(0, 10);setRange用于设置Y轴的范围。setRange(0, 10),包含[0,10]
设置等分
mAxY->setTickCount(11);setTickCount(11) 将范围内容进行10等分。因为[0-10]中间有10个空档位置

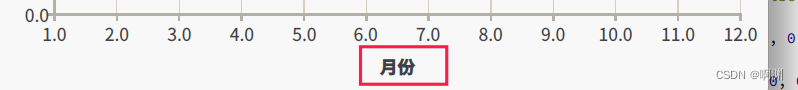
设置横纵轴标题
mAxX->setTitleText(QString(tr("月份")));
mAxY->setTitleText(QString(tr("销售额(万)")));
setTitleText:设置横纵轴的标题
折线设置
我们设置折线的内容。
给图表添加线条
通过addSeries我们可以添加多个线条。
m_ptrChart->addSeries(mLineSeries);设置突点
通过setPointsVisible我们可以设置其突点。
mLineSeries->setPointsVisible(true);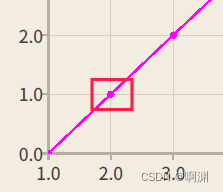
设置线段名称
setName用于设置其线段名称
![]()
设置线段名称展示位置
通过获取QLegend可以修改器展示位置
QLegend *mlegend = m_ptrChart->legend();
mlegend->setAlignment(Qt::AlignBottom);
mlegend->show();
设置前

设置后
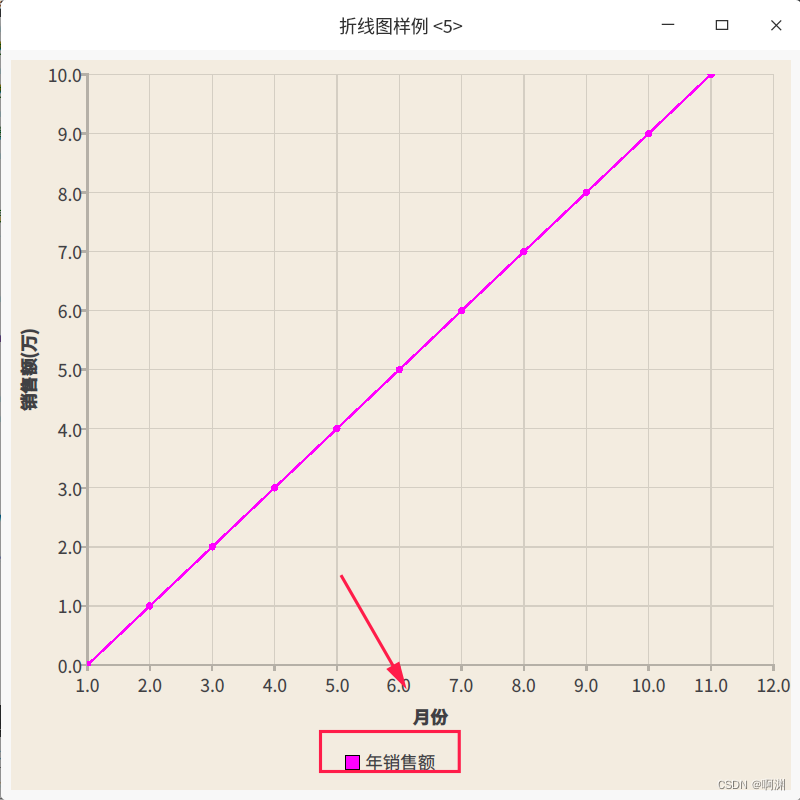
设置折线颜色
mLineSeries->setColor(QColor(255,0,255));
设置数据
  for(int i = 0 ;i <= 12;i++){
             mLineSeries->append(i+1, i);
     }
append(x,y)
x:x轴的数据,其范围需要在setRange设置范围内
y:y轴的数据,其范围需要在setRange设置范围内
源代码
git传送门
QtChartDemo/QBrokenLineDemo · master · 啊渊 / QT博客案例 · GitCode
#include "widget.h"
#include <QValueAxis>
#include <QTime>
Widget::Widget(QWidget *parent)
    : QWidget(parent)
    , m_ptrChart(new QChart)
    , m_ptrChartView(new QChartView())
    , mLineSeries(new QLineSeries)
{
   // setChart();
    initUI();
}

Widget::~Widget()
{

}

void Widget::initUI()
{
  //  (500,500);
     setWindowTitle("折线图样例");
     QValueAxis * mAxY = new QValueAxis();
     QValueAxis * mAxX = new QValueAxis();

      //y轴范围
      mAxY->setRange(0, 10);
      // Y轴分等份
      mAxY->setTickCount(11);
      mAxX->setRange(1,12);
      mAxX->setTickCount(12);
      // 分辨设置X轴和Y轴的标题
      mAxX->setTitleText(QString(tr("月份")));
      mAxY->setTitleText(QString(tr("销售额(万)")));
      // 将系列添加到图表
      m_ptrChart->addSeries(mLineSeries);
      m_ptrChart->setTheme(QtCharts::QChart::ChartThemeBrownSand);


      m_ptrChart->addAxis(mAxY, Qt::AlignLeft);
      m_ptrChart->addAxis(mAxX, Qt::AlignBottom);
      mLineSeries->attachAxis(mAxX);

      mLineSeries->attachAxis(mAxY);

      //突出曲线上的点
      mLineSeries->setPointsVisible(true);

      mLineSeries->setName("年销售额");
      // 设置颜色
      mLineSeries->setColor(QColor(255,0,255));


      //隐藏背景
      m_ptrChart->setBackgroundVisible(true);
      //设置外边界全部为0
      m_ptrChart->setContentsMargins(0, 0, 0, 0);
      //设置内边界全部为0
      m_ptrChart->setMargins(QMargins(0, 0, 0, 0));
      //设置背景区域无圆角
      m_ptrChart->setBackgroundRoundness(0);


      //在底部显示图例
     QLegend *mlegend = m_ptrChart->legend();
     mlegend->setAlignment(Qt::AlignBottom);
     mlegend->show();
      m_ptrChartView->setChart(m_ptrChart);
      for(int i = 0 ;i <= 12;i++){
             mLineSeries->append(i+1, i);
     }

      m_ptrChartView->setParent(this);
      m_ptrChartView->setMinimumSize(600,600);

}

void Widget::mousePressEvent(QMouseEvent *event)
{
    mLineSeries->clear();
    qsrand(QTime(0, 0, 0).secsTo(QTime::currentTime()));
    for(int i = 1 ;i <= 12;i++){
           mLineSeries->append(i, qrand()%11);
   }
}


