clc,clear,close all % 清理命令区、清理工作区、关闭显示图形
warning off % 消除警告
feature jit off % 加速代码运行
D0 = 4; % 阻止的频率点与频域中心的距离
u0 = 50;
v0 = 3;
im = imread(‘coloredChips.png’); % 原图像
R = imnoise(im(:,:,1),‘gaussian’,0,0.01); % R + 白噪声
G = imnoise(im(:,:,2),‘gaussian’,0,0.01); % G + 白噪声
B = imnoise(im(:,:,3),‘gaussian’,0,0.01); % B + 白噪声
im = cat(3,R,G,B); % 原图像 + 白噪声
H = freqfilter_gaussian_sink(2size(R,1),2size(R,2),u0,v0,D0); % 高斯陷波滤波器
R1 = fftfilt2(R,H); % 频域滤波
G1 = fftfilt2(G,H); % 频域滤波
B1 = fftfilt2(B,H); % 频域滤波
im1 = cat(3,R1,G1,B1);
im1 = uint8(im1);
figure(‘color’,[1,1,1])
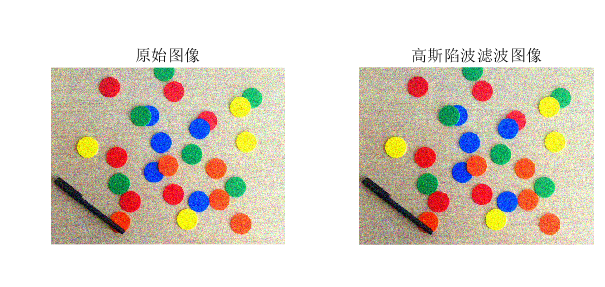
subplot(121),imshow(im,[]); title(‘原始图像’)
subplot(122),imshow(im1,[]); title(‘高斯陷波滤波图像’);
0
点赞
收藏
分享
MATLAB高斯陷波滤波图像
相关推荐


0 条评论
